In the beginning Uniform: Difference between revisions
No edit summary |
No edit summary |
||
| (2 intermediate revisions by one other user not shown) | |||
| Line 1: | Line 1: | ||
[[GFtbox Tutorial pages|Back to Tutorial pages]]<br><br> | [[GFtbox Tutorial pages|Back to Tutorial pages]]<br><br> | ||
=Modelling uniform growth using the GUI alone= | =Modelling uniform growth using the GUI alone= | ||
==First view== | ==First view== | ||
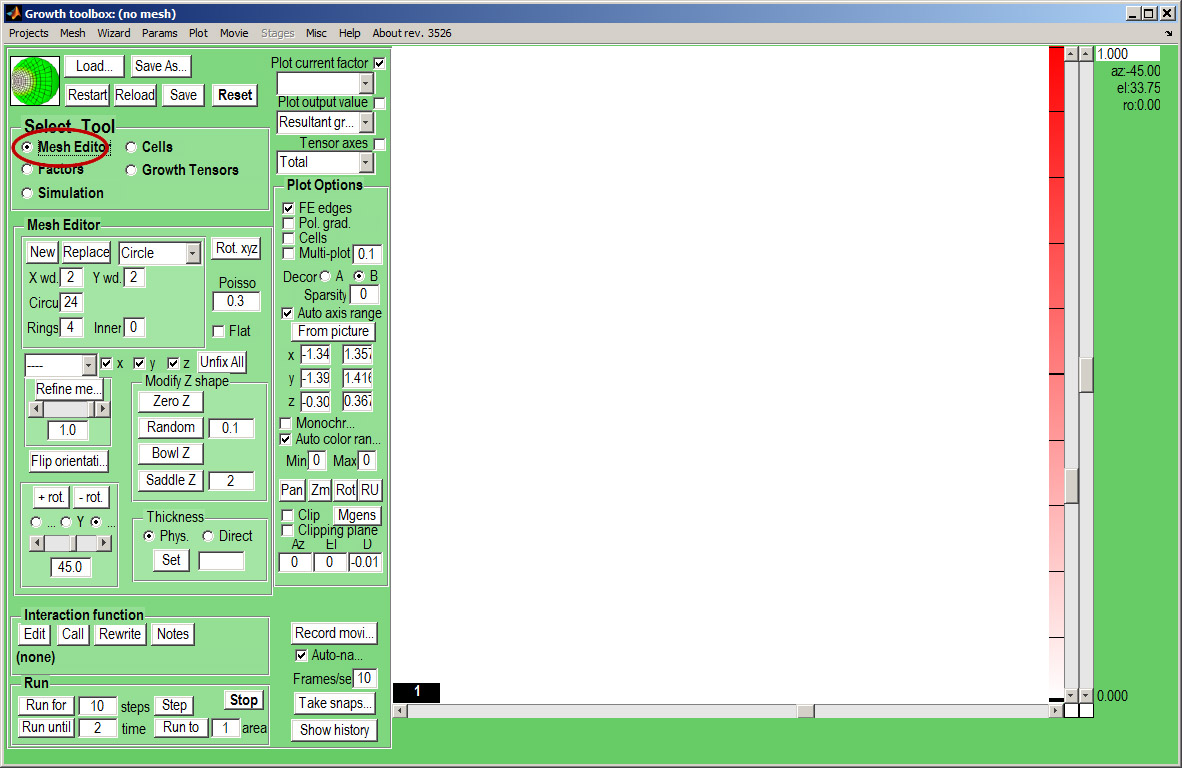
The GUI controls are organised into a number of panels. The largest is the plotting window on the right. Just to the left is a column of buttons, tick boxes, drop-down lists and buttons that control what appears in the plotting window.<br><br> | |||
At the top left is a panel for loading and saving projects.<br><br> | |||
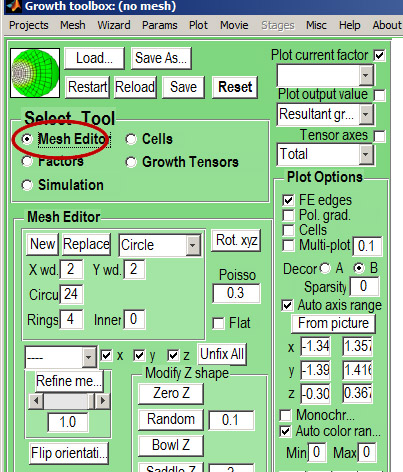
Below this is a panel for selecting tools. These buttons select what panel will be visible below, e.g. Mesh Editor, Factor, etc.<br><br> | |||
At the bottom left the Run panel contains controls for running the model: Step, run for a specified number of steps, for a specified (model) time, run to a certain area (e.g. 2 times starting area). Above the Run panel is a panel for creating and editing the interaction function.<br><br> | |||
There are also controls on the Menu bar. | |||
{| border="1" cellpadding="5" cellspacing="5" | {| border="1" cellpadding="5" cellspacing="5" | ||
|- valign="top" | |- valign="top" | ||
| Line 13: | Line 21: | ||
{| border="1" cellpadding="5" cellspacing="5" | {| border="1" cellpadding="5" cellspacing="5" | ||
|- valign="top" | |- valign="top" | ||
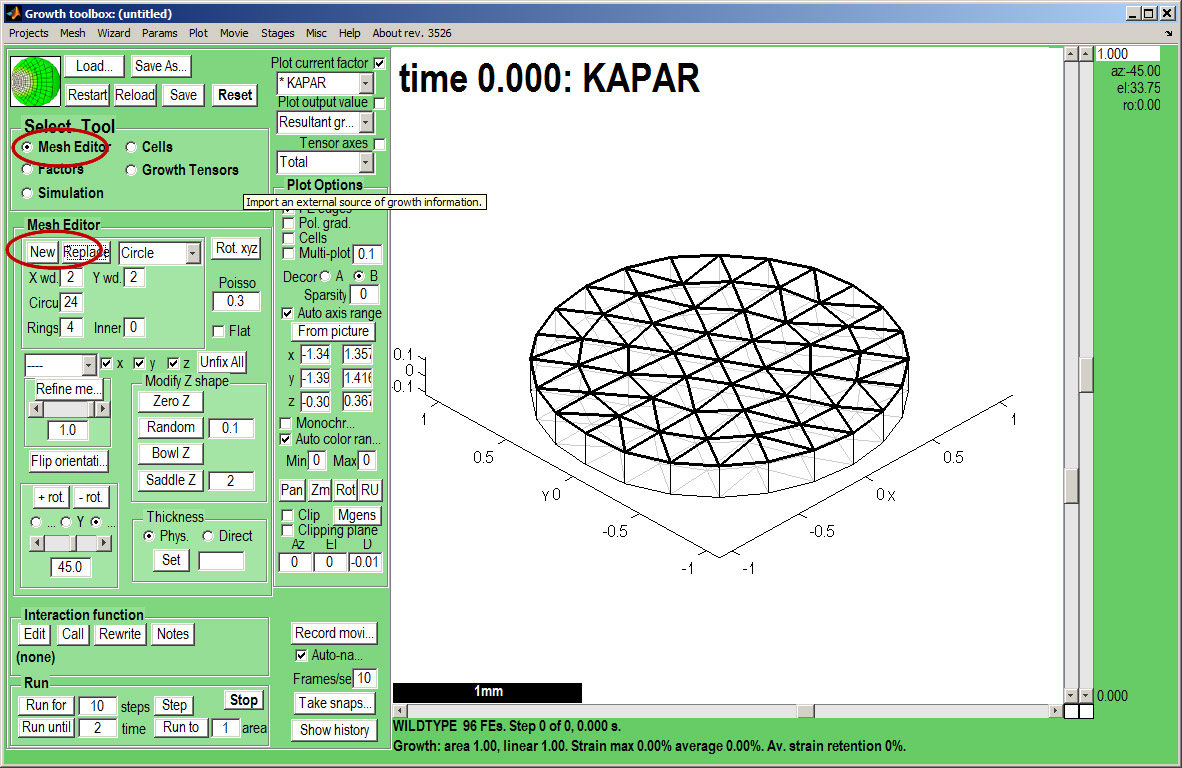
|width="300px"|Create a canvas by clicking on ''Panel Mesh Editor:new''. A variety of preset shapes | |width="300px"|Create a canvas by clicking on ''Panel Mesh Editor:new''. A variety of preset shapes is available. Here we choose a Circle with 4 concentric rings of nodes that is 2 mm in diameter.<br><br>By default the mesh is autoscaled and autocentred - it makes it easier to see shape changes but to see growth these are best turned off. Set the Panel:Plot options:Auto axis range to unticked and insert plot ranges -2.5 to 2.5 on x and y axes and 0 0 on z. Also turn off Menu:Plot:Autozoom and centre.<br><br><small>Idea: Special shapes can be imported as ''OBJ'' files. ''</small> | ||
|width="500px"|[[File:gftboxGUIB_2.jpg|500px|GFtbox interface]] | |width="500px"|[[File:gftboxGUIB_2.jpg|500px|GFtbox interface]] | ||
|} | |} | ||
| Line 25: | Line 33: | ||
{| border="1" cellpadding="5" cellspacing="5" | {| border="1" cellpadding="5" cellspacing="5" | ||
|- valign="top" | |- valign="top" | ||
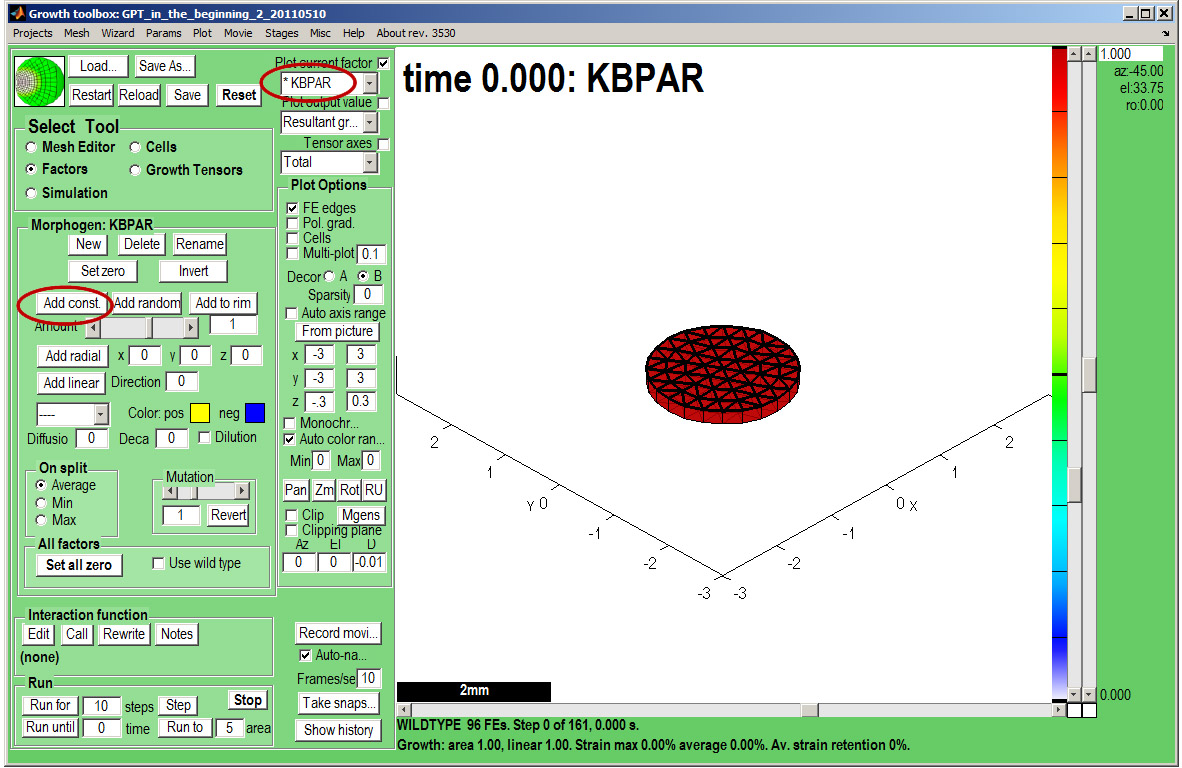
|width="300px"|'''Now save the project''' using the ''Save As'' button. A dialogue box will open - here we keyed in ''in_the_beginning'' and the prefix ''GPT_'' and the suffix ''_date'' | |width="300px"|'''Now save the project''' using the ''Save As'' button. A dialogue box will open - here we keyed in ''in_the_beginning'', and the prefix ''GPT_'' and the suffix ''_date'' were added automatically.<br>A directory is created with the project name which contains all the files needed for the project and any results (snapshots, movies) we create.<br> | ||
''Select Tool:Simulation'' makes the ''Simulation'' Panel visible. <br> | ''Select Tool:Simulation'' makes the ''Simulation'' Panel visible. <br> | ||
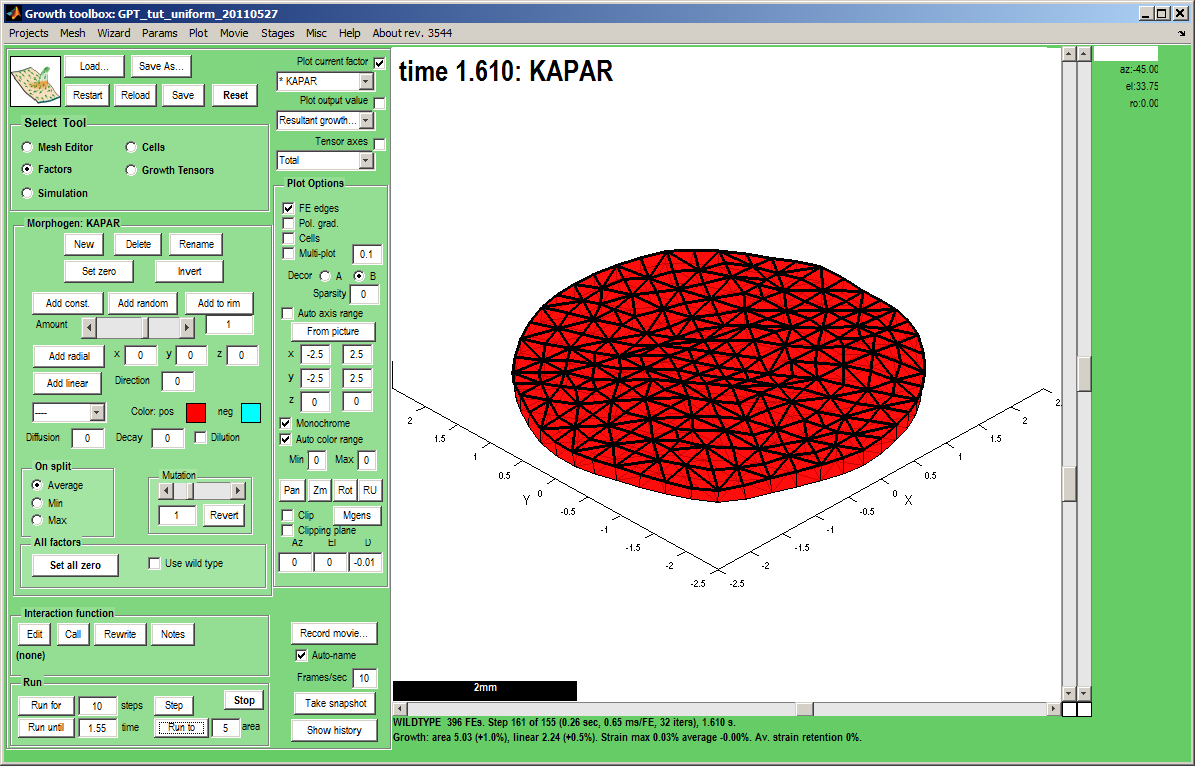
Change the ''Panel Run:Run until'' box to 2 and click the ''Panel Run:Run until'' button. The canvas will grow in steps set by the ''Panel Simulation:Timescale'' box.<br><br> | Change the ''Panel Run:Run until'' box to 2 and click the ''Panel Run:Run until'' button. The canvas will grow in steps set by the ''Panel Simulation:Timescale'' box.<br><br> | ||
| Line 31: | Line 39: | ||
Idea: set the axes manually (here to +-3) and turn off Panel:Plot Options: Auto axis range and Menu:Plot:Auto zoom and centre. This enables growth to be seen as a change of size rather than change of axis range. | Idea: set the axes manually (here to +-3) and turn off Panel:Plot Options: Auto axis range and Menu:Plot:Auto zoom and centre. This enables growth to be seen as a change of size rather than change of axis range. | ||
Idea: take a snapshot of the canvas by pressing Take snap... (c.f. image on right, button is bottom right of GUI controls)<br> | Idea: take a snapshot of the canvas by pressing Take snap... (c.f. image on right, button is bottom right of GUI controls)<br> | ||
Idea: to create | Idea: to create a movie of your simulation, before running click the ''Record movie'' and when it is finished click ''Stop movie''. The movie will be in the directory containing the current project, which you can open with the menu command Projects:Show Current Project Folder.</small> | ||
|width="500px"|[[Image:tut_uniform_growth_final.png|500px|GFtbox interface]] | |width="500px"|[[Image:tut_uniform_growth_final.png|500px|GFtbox interface]] The canvas is not flat because it started not flat. By default, a new mesh is given a small random perturbation to allow deformations out of the plane. | ||
|} | |} | ||
Latest revision as of 15:02, 24 June 2011
Modelling uniform growth using the GUI alone
First view
The GUI controls are organised into a number of panels. The largest is the plotting window on the right. Just to the left is a column of buttons, tick boxes, drop-down lists and buttons that control what appears in the plotting window.
At the top left is a panel for loading and saving projects.
Below this is a panel for selecting tools. These buttons select what panel will be visible below, e.g. Mesh Editor, Factor, etc.
At the bottom left the Run panel contains controls for running the model: Step, run for a specified number of steps, for a specified (model) time, run to a certain area (e.g. 2 times starting area). Above the Run panel is a panel for creating and editing the interaction function.
There are also controls on the Menu bar.
| The GFtbox user interface. Focus on the Select Tool Panel. Here the Mesh Editor has been selected and the Mesh Editor panel is visible.
|
|
