SectorAnalysisToolbox Details: Difference between revisions
Jump to navigation
Jump to search
No edit summary |
No edit summary |
||
| Line 4: | Line 4: | ||
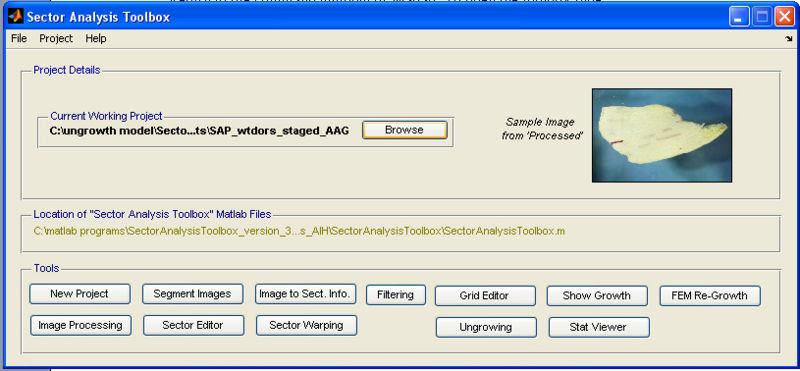
[[Image:SAT_Main.jpg|256px|thumb|The SAT main application window.]] | [[Image:SAT_Main.jpg|256px|thumb|The SAT main application window.]] | ||
<span style="color: Navy">'''What'''?</span> The Sector Analysis Toolbox '''(SAT)''' is used ''' to quantify patterns of growth by analysing the shapes of patches of cells, clones. | <span style="color: Navy">'''What'''?</span> The Sector Analysis Toolbox '''(SAT)''' is used ''' to quantify patterns of growth''' by analysing the shapes of patches of cells, clones. | ||
<span style="color: Navy">'''How'''?</span> The Sector Analysis Toolbox is coded in '''Matlab''' and a valid Matlab licence is required to use it.<br> | <span style="color: Navy">'''How'''?</span> The Sector Analysis Toolbox is coded in '''Matlab''' and a valid Matlab licence is required to use it.<br> | ||
Revision as of 08:20, 16 March 2012
What? How? Where?

What? The Sector Analysis Toolbox (SAT) is used to quantify patterns of growth by analysing the shapes of patches of cells, clones.
How? The Sector Analysis Toolbox is coded in Matlab and a valid Matlab licence is required to use it.
Where? The toolbox is available for download here.
Requirements: MATLAB.