MSER's and Connected sets: Difference between revisions
Jump to navigation
Jump to search
No edit summary |
|||
| (8 intermediate revisions by the same user not shown) | |||
| Line 1: | Line 1: | ||
[http://cmpdartsvr3.cmp.uea.ac.uk/wiki/BanghamLab/index.php/Software#MSERs.2C_extrema.2C_connected-set_filters_and_sieves Return to connected-sets]<br><br> | [http://cmpdartsvr3.cmp.uea.ac.uk/wiki/BanghamLab/index.php/Software#MSERs.2C_extrema.2C_connected-set_filters_and_sieves Return to connected-sets]<br><br> | ||
== | ==[[Mean and median filters bad|<span style="color:red">Mean and median filters '''''bad'''''</span>]]== | ||
=====Then after a couple of twists===== | |||
==[[Gaussian and sieve filters|<span style="color:red">Gaussian and sieve filters '''''good'''''</span>]]== | |||
{| border="0" width=100% style="background-color:#ffffff;" | |||
|- | |||
|align="left"| | |||
[[Details_on_hydrophobicity_plots | The first published application of the data-sieve as reviewed by Fasman, click here ...</span>]] | |||
|[[Image:hydrophobicity_plots_Fasman.jpg|right|300px]] | |||
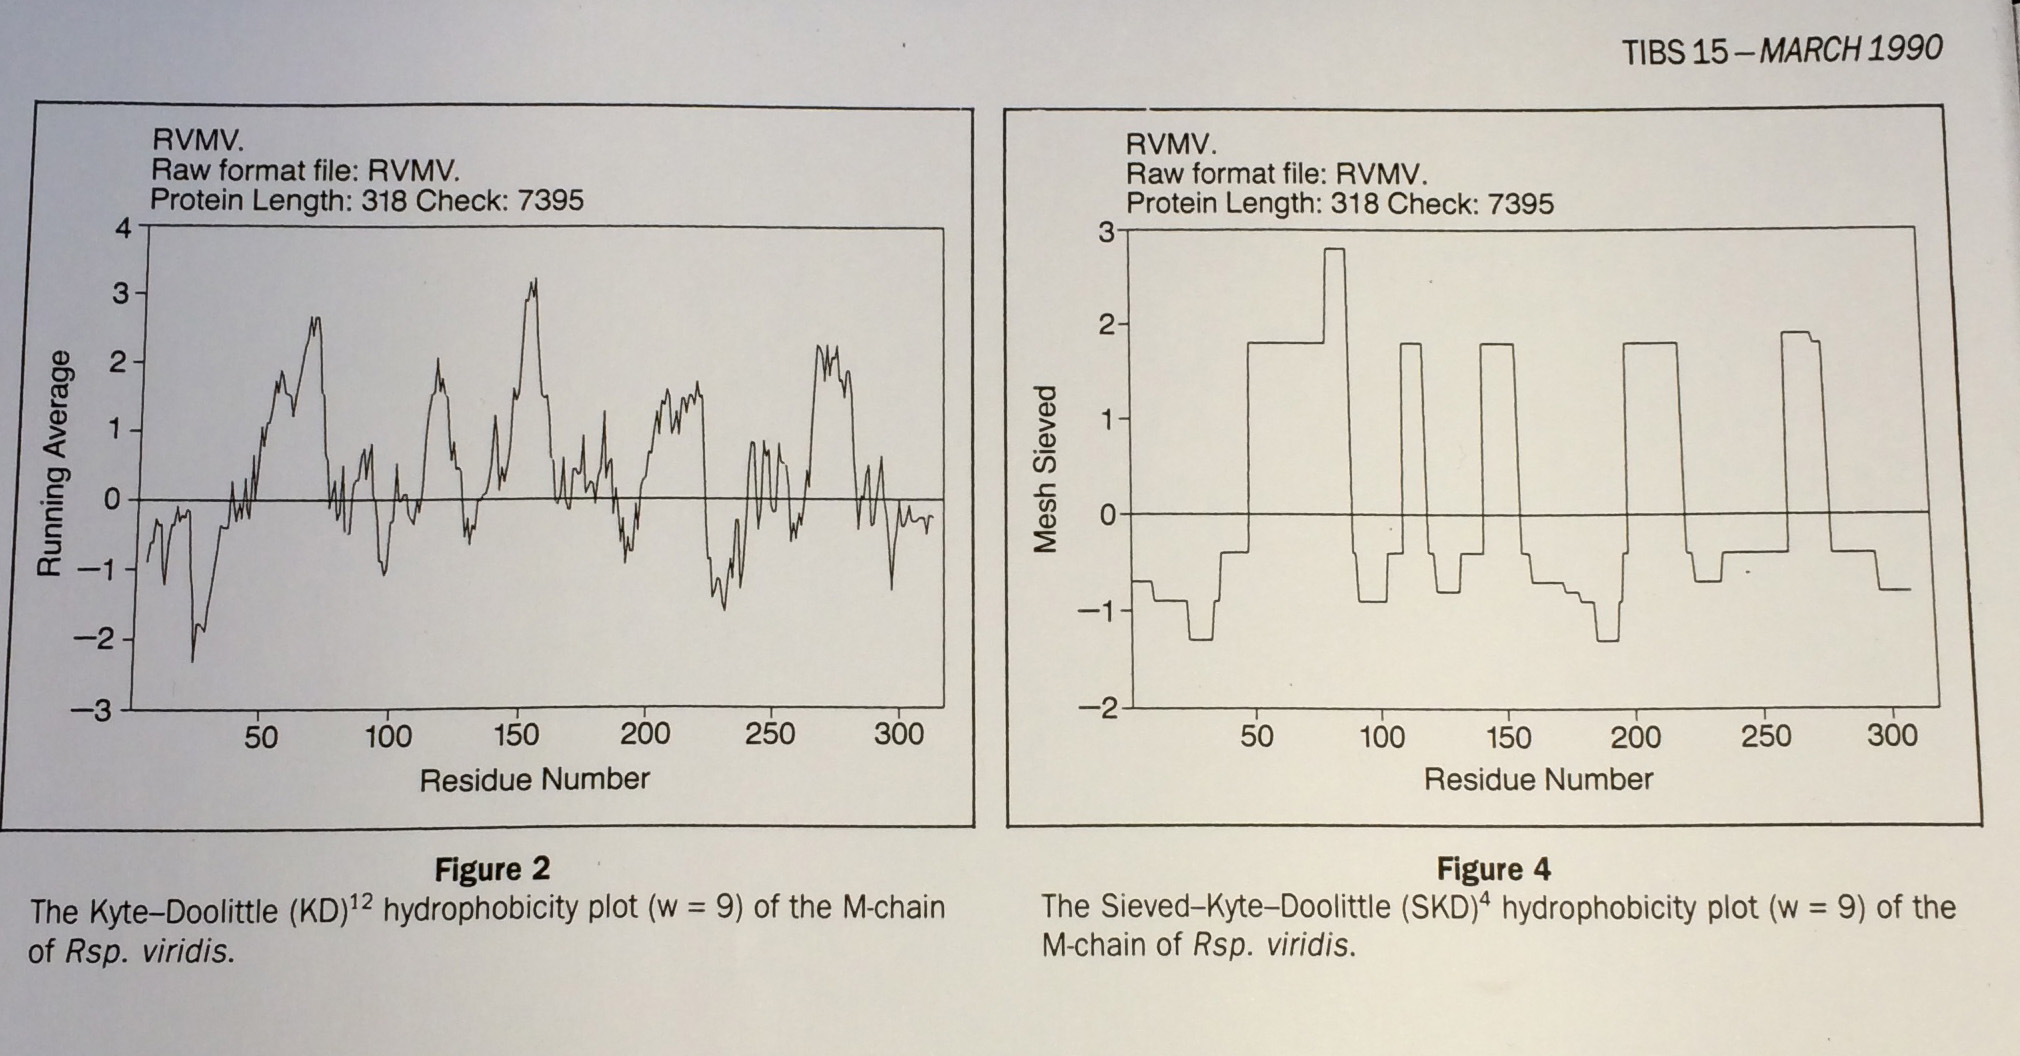
|From Fasman and Gilbert "The prediction of transmembrane protein sequences and their conformation: an evaluation" in Trends in Biochemistry 15 pp 89:91 | |||
Left: Running mean (c.f Gaussian): <span style="color:#C364C5;">no good</span>, Right: Median based Data-sieve: <span style="color:#C364C5;">much better</span> | |||
|} | |||
=<span style="color:Chocolate">'''''Extrema''''' to trees<span style="color:Chocolate">= | |||
====One dimensional A==== | |||
{| border="0" cellpadding="5" cellspacing="5" | {| border="0" cellpadding="5" cellspacing="5" | ||
|- valign="top" | |- valign="top" | ||
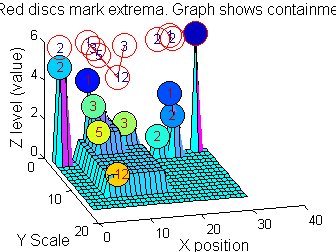
|width="50%"| | |width="50%"|[[One dimensional sieve introduction|<span style="color:Navy">''What are MSER's in one dimension?'']]</span> | ||
| [[Image:IllustrateSIV_1_01.gif|350px|link=One dimensional sieve introduction|AAMToolbox]] | |||
|} | |||
====One dimensional B==== | |||
{| border="0" cellpadding="5" cellspacing="5" | |||
|- valign="top" | |||
|width="50%"|[[One dimensional sieve applied to images|<span style="color:Navy">''One dimensional extrema in images'']]</span> | |||
| [[Image:IllustrateSIV_1_01.gif|350px|link=One dimensional sieve introduction|AAMToolbox]] | | [[Image:IllustrateSIV_1_01.gif|350px|link=One dimensional sieve introduction|AAMToolbox]] | ||
|} | |} | ||
Latest revision as of 18:54, 12 August 2014
Mean and median filters bad
Then after a couple of twists
Gaussian and sieve filters good
|
The first published application of the data-sieve as reviewed by Fasman, click here ... |
 |
From Fasman and Gilbert "The prediction of transmembrane protein sequences and their conformation: an evaluation" in Trends in Biochemistry 15 pp 89:91
Left: Running mean (c.f Gaussian): no good, Right: Median based Data-sieve: much better |
Extrema to trees
One dimensional A
| What are MSER's in one dimension? | 
|
One dimensional B
| One dimensional extrema in images | 
|