Measuring using interaction function subroutines
1 A
- Measuring growth
-
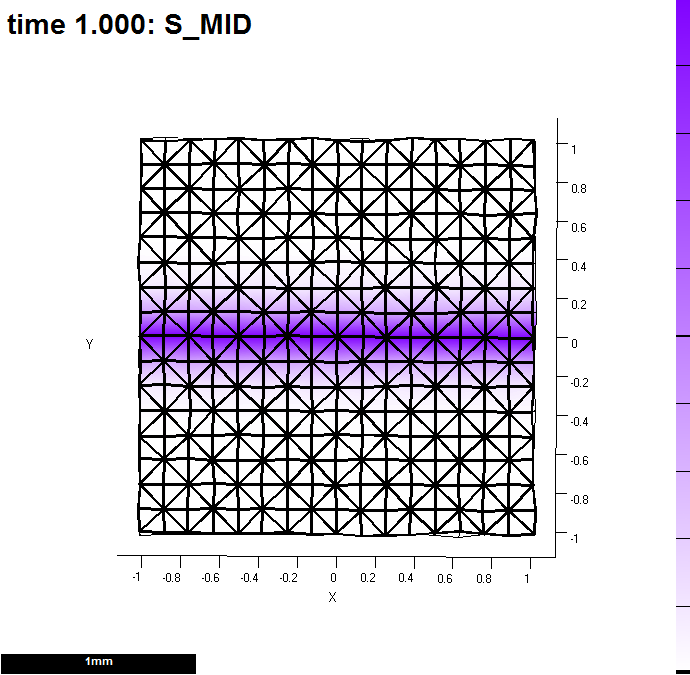 (A) A single row of vertices (id_mid) labels a line along which measurements will be made. Here, it provides a source for s_mid.
 -
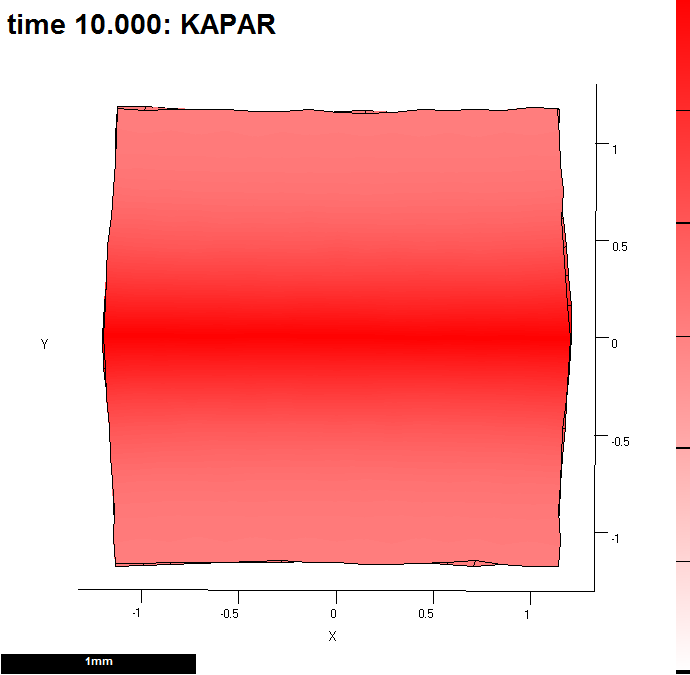 (B) Kapar is promoted by s_a. Here, after 10 steps. We are going to view growth along id_mid.
 -
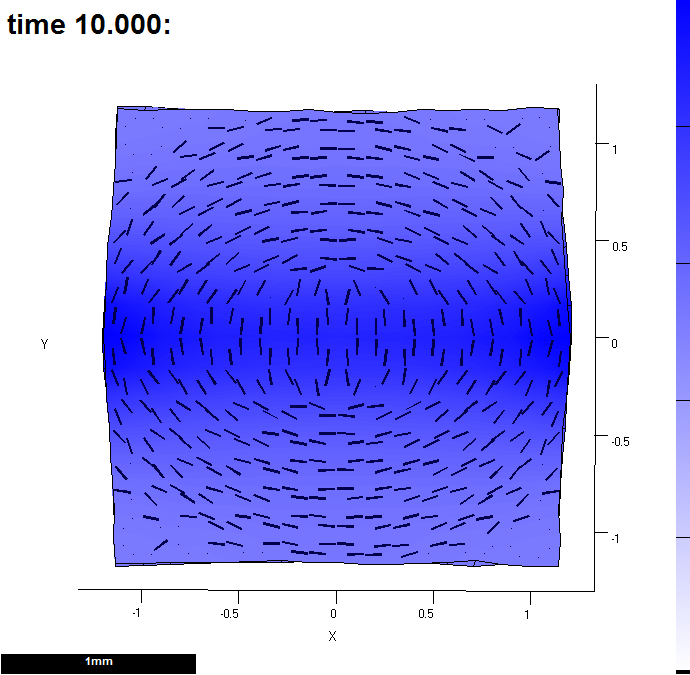 (C) It has been through the interaction function 9 times. This shows the growth by the time it has reached the end of the 9th pass. Colour shows growth rate over the last time step and lines indicate the major axis.
 -
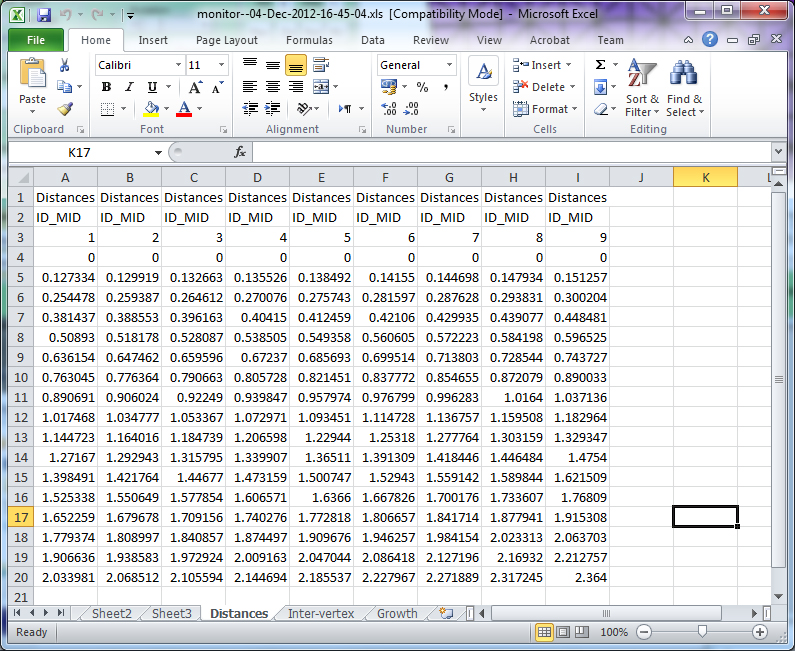 (D) Spreadsheet showing distances along the line each time the system went through the interaction function. Line 3 shows the time. Column of numbers (lines 4 to 19) shows the distances of each vertex along i_mid. The spreadsheet is saved to the project snapshots directory.
 -
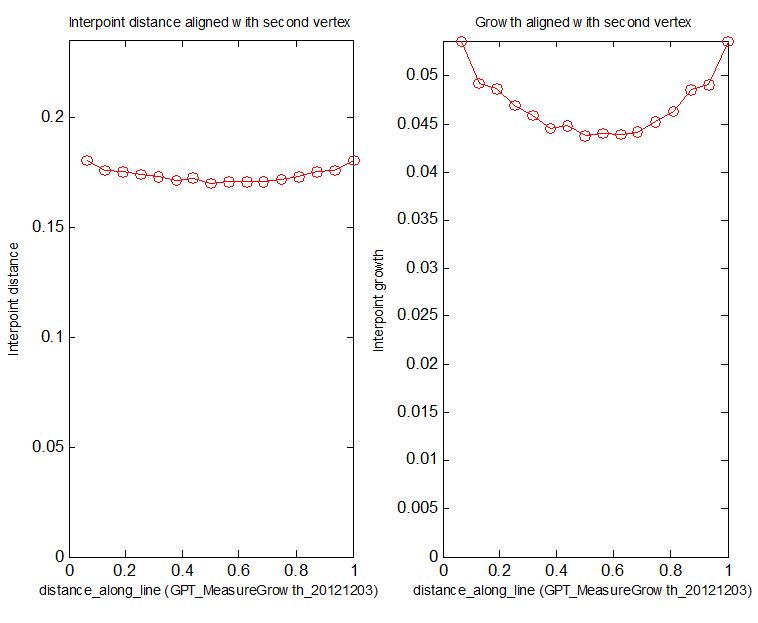 (E) Left panel: distances between successive vertices along id_mid. Right panel: growth at each vertex along id_mid.


|}