AAMToolbox statistical model generator
Statistical shape generator (PCA)
Principle component analysis of point-models and image pixel values (appearance models)
To run the PCA select Stats Model Generator from the AAMToolbox control panel:
Inputs and outputs
- Shape model
- Input: landmark points, i.e. the point-models for all images of interest.
- Output: mean shape and associated shape model that captures deviations from the mean. Enough principle components are included to account for 95% of the variance from the mean (set using Options).
- Appearance model
- Input: landmark points, i.e. the point-models together with the image intensity within triangles determined by a Delauny triangulation of the points.
- Output: mean appearance and associated appearance model that captures deviations from the mean.
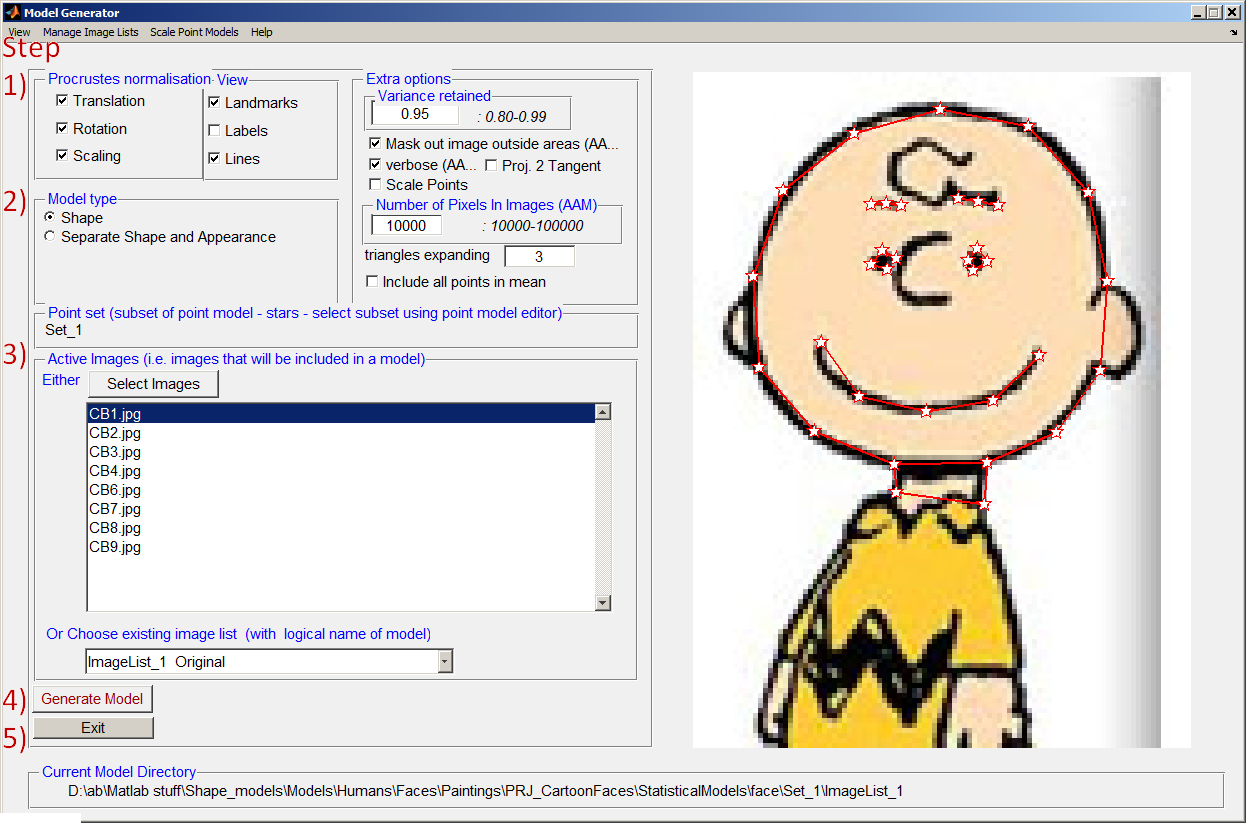
Statistical Model Generator control panel.
Showing the steps (in red) to build a statistical model.

Steps to build a shape model using principle component analysis (PCA)
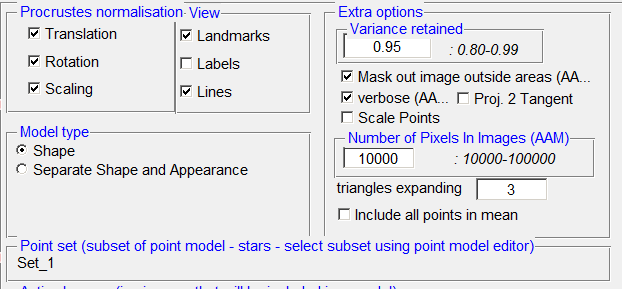
Step 1) Options
- The first step in PCA is to align all the point models. In this case we assume that the images should be normalised to the same scale, same rotation and same translational position. This might not always be the case. If we want to model leaf growth then the point model should not be scaled. Alternatively, if we want to capture the pose of a face portrait the point models should not be rotationally aligned.
For the cartoon faces we normalise for all three.
Step 2) Type of model
In this case the statistical Shape model will be generated from the point models alone. In other cases, we might want to include the image colours, pixel by pixel, in the PCA in which case we create two models Shape and Appearance (AAM).
- If AAM then
- Select whether to mask out the image not within the a boundary set by the outermost landmark points
- Select the number of pixels to be used when forming the mean image intensity (appearance).
- Point set. The AAMToolbox supports the concept of point model 'sets'. In other words, subsets of landmarks can be grouped together into a set. Set_1 is always all the points. The points that are currently selected are shown as stars. Here, all the points are selected. The options are discussed in the Tutorial on 'sets'.
- If modelling a subset of landmark points it can be useful to place the model at the mean position of all the landmarks. This can be selected by ticking 'include all points in mean'. (A subset of landmark points is selected in the AAMToolbox:Point Model Editor.)
- If AAM then
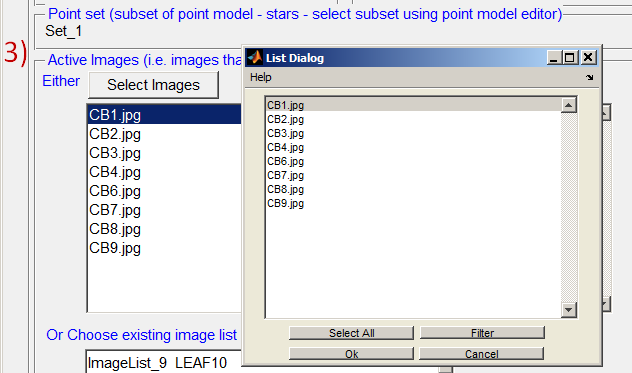
===Step 3) Point models and images to contribute to the model
- Select the image point models you want to include. Usually all of them.
- You will invited to give a name to the model you are about to compute
Step 4) Generate Model
Step 5) Exit
- The next step is to view results from the model, AAMToolbox: View Stats Mode

