MTtbox documentation
Return to Bangham Lab Software
Why?
The aim is to model the growth of microtubules (and other dynamic organelles such as actin). Organelles grow through chemical reactions and growing organelles can collide with other organelles and membranes. To address these two features we adopted a data structure that stores microtubules as a list of vertices each of which is associated with a volume. Volumes are represented by a three dimensional array (lattice) of voxels. Regions within this volume are designated by numerical labels, e.g. 0 for cytoplasm, -4 for plasma-membrane. The size of the entire volume determines the resolution of both the collision detection system and chemical reaction/diffusion system. Resolution increases with the number of voxels. Increasing the number of voxels decreases the speed of computation and increases the demand for memory (>=16 Gbytes memory is highly desirable).
Current Status
MTtbox is currently under test and further development
The main data structure is called: 'data'. It can be accessed from the Matlab command line by declaring data to be global.
global data
at any time. The following documentation will refer to fields in data. It also refers to the custom menu items by menu:name.
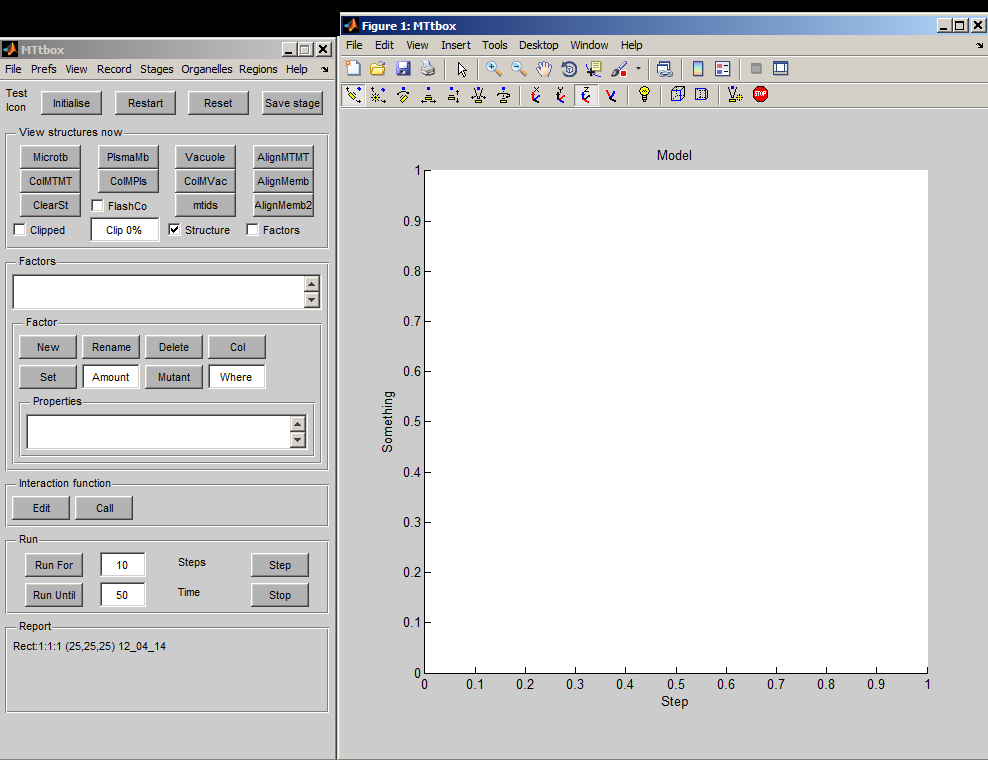
The MTtbox graphical user interface (GUI) was created using the rapid prototyping system: DArT_Toolshed\ToolBag\Demo of JRK GUI\GuiDemo.m. This uses a text file GuiDemoLayout.txt to specify the GUI. The GUI has a control panel (handle: data.PanelH) and a graphics panel (handle: data.plotprops.AxesH) The MTtbox control panel is specified by MTtboxLayout.txt.
First view of the MTtbox
1 A
1 B
1 C
| A project is saved by selecting: menu:File:Save as Having first saved a project a default Interaction Function is created by selecting Edit. A default project file contains lots of comments to provide help on how to develop the project. At present the Interaction Functions is not copied to the new project on each Save as command - this has to be done manually. |
(Comments are in green - this web version of the matlab file is created using webify_interaction_function('MT_Edinb_20120427.m')). The default file is largely a copy of MTtbox_BoilerPlate.txt which should be updated to reflect the latest ideas on how to build the function.
|
Graphical User Interface
2 A Changing organelles in the cell
| menu:Organelles shows a list of organelles, check those that are required and then re-establish the working volumes (used for collision detection) by using menu:Prefs:Cell size and shape |
2 B Changing working volumes used for collision detection and representing the concentrations of factors in each region
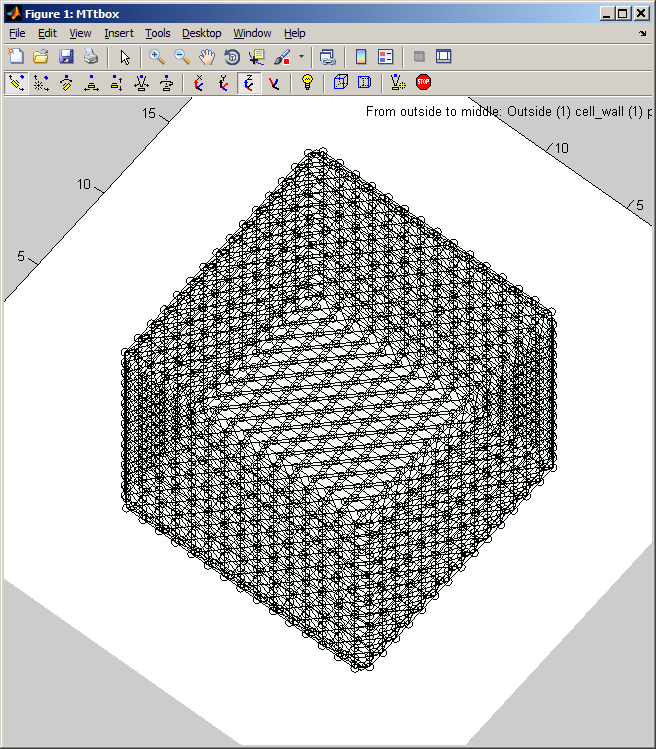
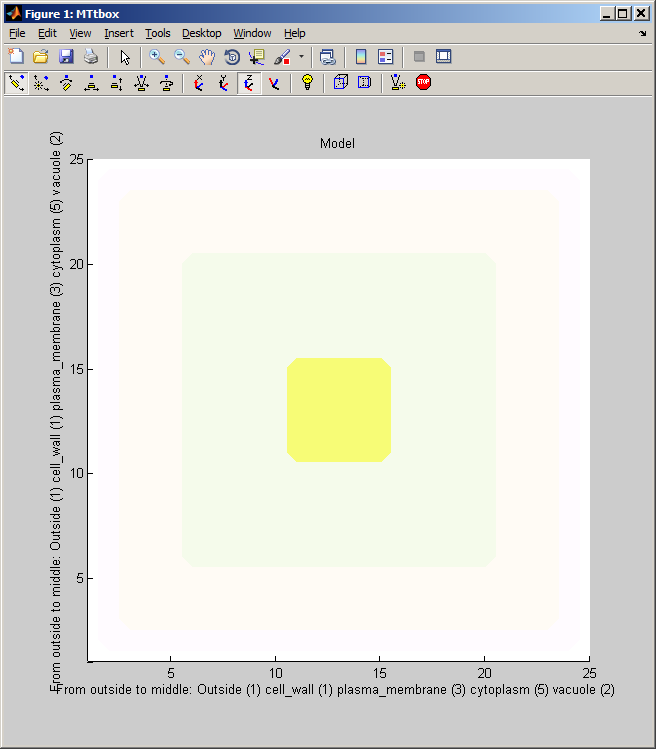
menu:Prefs:Cell size and shape establishes the shape of the cell and the arrangement of static organelles. The data structure it creates underpins the collision detection system.
data.cellprops.Vol is a volume filled with labels (range 0 to -7) representing regions: not-cell, cell-wall, plasma-membrane, cytoplasm, vacuole, etc. It is re-formed whenever the cell is redefined with pushbutton Initialise. data.working.Vol is a copy of data.cellprops.Vol which also contains regions representing dynamic organelles (microtubules and actin). It is re-zeroed by Restart. There are further volumes that supplement these two that are used for collision detection. Individual microtubule regions are recorded in data.cellprops.microtubules.Vol each microtubule region is represented by a unique ID. data.factorprops.Concentration data.factorprops.DiffusionConst each column of which represents a factor - they must be reshaped to the same format as the volume data. |


