Measuring using interaction function subroutines: Difference between revisions
No edit summary |
No edit summary |
||
| Line 1: | Line 1: | ||
[[GFtbox Tutorial pages#Hints and Tips| Return to tutorials]]<br><br> | [[GFtbox Tutorial pages#Hints and Tips| Return to tutorials]]<br><br> | ||
=== | ===Measuring growth of a model=== | ||
There are two auxiliary functions: | |||
[out1, out2, out3, out4] = leaf_computeGrowthFromDisplacements( m, displacements, time, ... ) | |||
Compute the growth rate in each FE of m given the displacements of all | |||
the prism nodes and the time over which these displacements happened. | |||
This assumes that m is in the state after these | |||
displacements have happened. The results returned depend on the | |||
options and on how many output arguments are given. Note that unlike | |||
most leaf_* commands, m itself is not one of the output arguments, | |||
since this procedure does not need to modify m. | |||
function m=leaf_profile_monitor(m,realtime,RegionLabels,Morphogens,start_figno) | |||
monitor morphogen levels at a set of vertices | |||
m, mesh | |||
RegionLabels, vertices to be monitored as designated by cell array of strings, i.e. region labels | |||
Morphogens, cell array of strings, i.e. uppercase morphogen names to | |||
be monitored. There should be one RegionLabels string for each | |||
Morphogens string | |||
Vertlabels, if true then display vertex numbers in each regionlabel on | |||
the mesh default false | |||
start_figno, default figure 1 (Must open a fig even if just monitoring to file) | |||
MonData, optional output of data structure | |||
<gallery caption="Measuring growth" widths="300px" heights="300px" perrow="4" border="0"> | <gallery caption="Measuring growth" widths="300px" heights="300px" perrow="4" border="0"> | ||
Image:GPT MeasureGrowth 20121203-000001-0001.png |(A) A single row of vertices (id_mid) labels a line along which measurements will be made. Here, it provides a source for s_mid. | Image:GPT MeasureGrowth 20121203-000001-0001.png |(A) A single row of vertices (id_mid) labels a line along which measurements will be made. Here, it provides a source for s_mid. | ||
| Line 9: | Line 32: | ||
</gallery> | </gallery> | ||
<br> | <br> | ||
Revision as of 12:21, 5 December 2012
Measuring growth of a model
There are two auxiliary functions:
[out1, out2, out3, out4] = leaf_computeGrowthFromDisplacements( m, displacements, time, ... )
   Compute the growth rate in each FE of m given the displacements of all
   the prism nodes and the time over which these displacements happened.
   This assumes that m is in the state after these
   displacements have happened.  The results returned depend on the
   options and on how many output arguments are given.  Note that unlike
   most leaf_* commands, m itself is not one of the output arguments,
   since this procedure does not need to modify m.
function  m=leaf_profile_monitor(m,realtime,RegionLabels,Morphogens,start_figno)
monitor morphogen levels at a set of vertices

m, mesh
RegionLabels, vertices to be monitored as designated by cell array of strings, i.e. region labels
Morphogens, cell array of strings, i.e. uppercase morphogen names to
   be monitored. There should be one RegionLabels string for each
   Morphogens string
Vertlabels, if true then display vertex numbers in each regionlabel on
         the mesh default false
start_figno, default figure 1 (Must open a fig even if just monitoring to file)

MonData, optional output of data structure
- Measuring growth
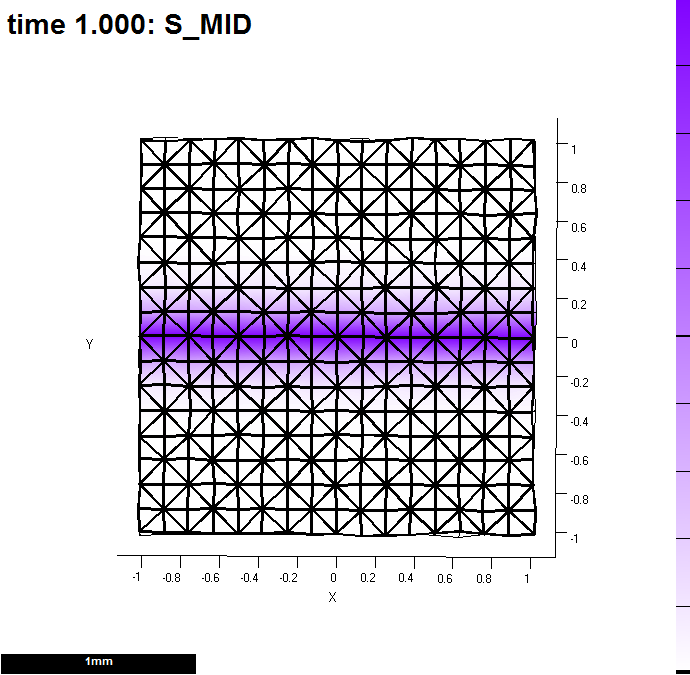
(A) A single row of vertices (id_mid) labels a line along which measurements will be made. Here, it provides a source for s_mid.
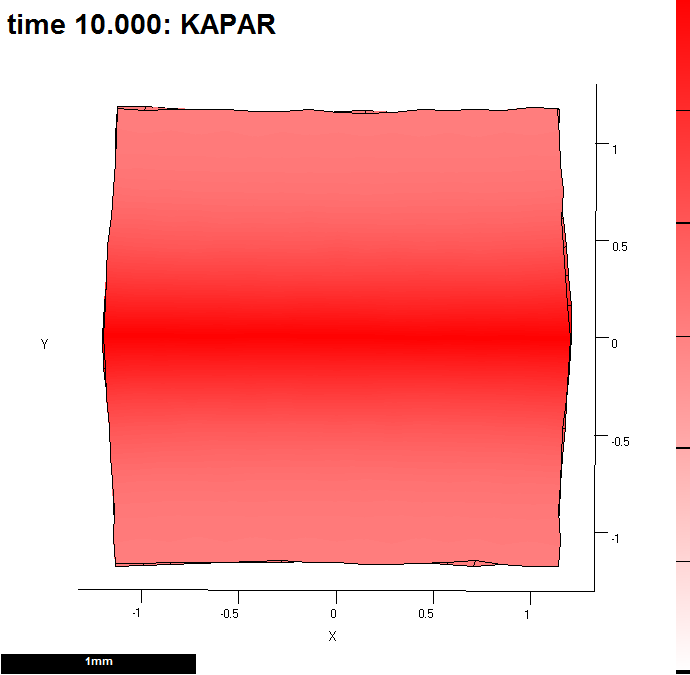
(B) Kapar is promoted by s_a. Here, after 10 steps. We are going to view growth along id_mid.
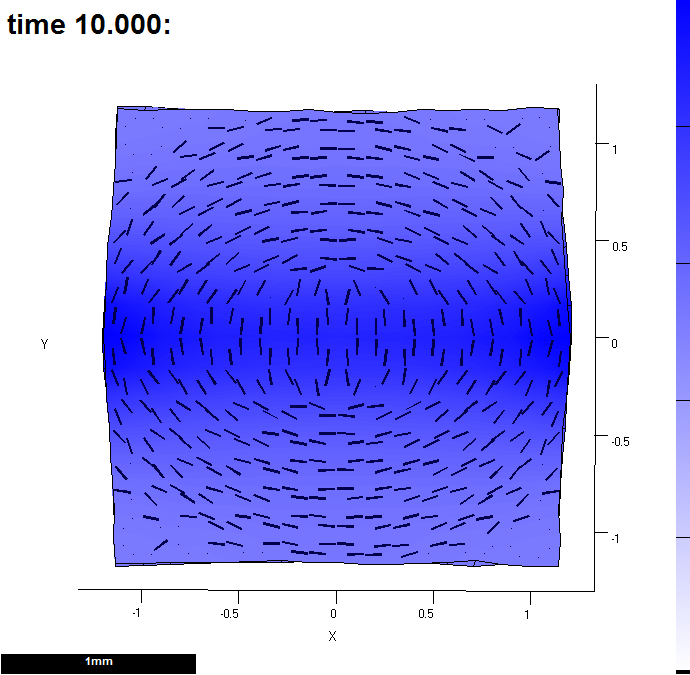
(C) It has been through the interaction function 9 times. This shows the growth by the time it has reached the end of the 9th pass. Colour shows growth rate over the last time step and lines indicate the major axis.
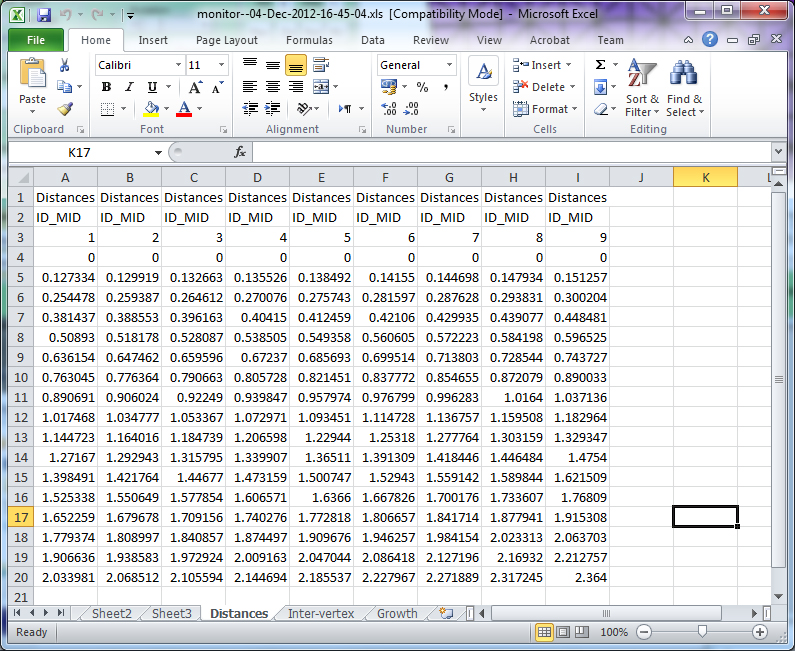
(D) Spreadsheet showing distances along the line each time the system went through the interaction function. Line 3 shows the time. Column of numbers (lines 4 to 19) shows the distances of each vertex along i_mid. The spreadsheet is saved to the project snapshots directory.
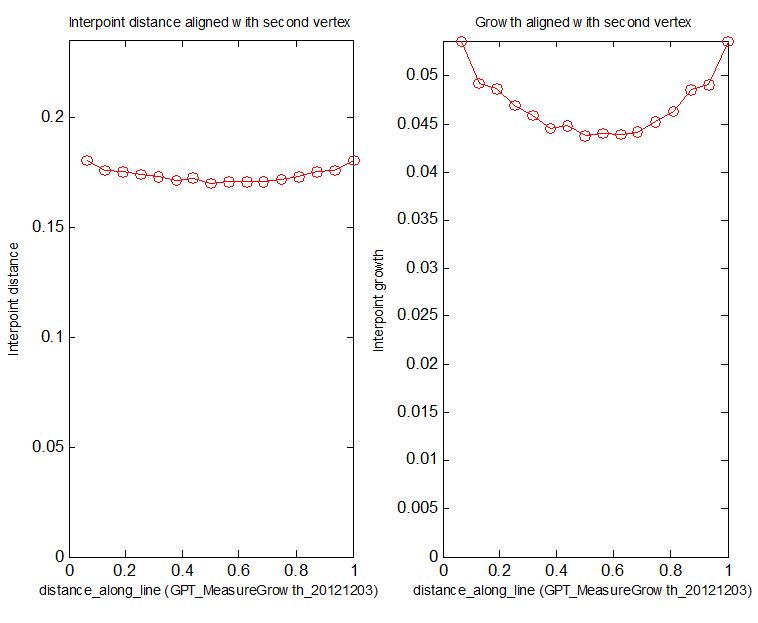
(E) Left panel: distances between successive vertices along id_mid. Right panel: growth at each vertex along id_mid.


