Measuring using interaction function subroutines: Difference between revisions
No edit summary |
No edit summary |
||
| (6 intermediate revisions by the same user not shown) | |||
| Line 1: | Line 1: | ||
[[GFtbox Tutorial pages#Hints and Tips| Return to tutorials]]<br><br> | [[GFtbox Tutorial pages#Hints and Tips| Return to tutorials]]<br><br> | ||
=== | ===Measuring growth of a model=== | ||
[http://cmpdartsvr1.cmp.uea.ac.uk/downloads/software/GPT_MeasureGrowth_20121203.zip <span style="color: Navy">Download a project illustrating measurements GPT_MeasureGrowth_20121203</span>]<br><br> | |||
The GPT_MeasureGrowth_20121203 interaction function is shown at the bottom of this page.<br><br> | |||
There are several ways to measure growth on the model. For example, there are two auxiliary functions: | |||
[out1, out2, out3, out4] = leaf_computeGrowthFromDisplacements( m, displacements, time, ... ) | |||
Compute the growth rate in each FE of m given the displacements of all | |||
the prism nodes and the time over which these displacements happened. | |||
This assumes that m is in the state after these | |||
displacements have happened. The results returned depend on the | |||
options and on how many output arguments are given. Note that unlike | |||
most leaf_* commands, m itself is not one of the output arguments, | |||
since this procedure does not need to modify m. | |||
function m=leaf_profile_monitor(m,realtime,RegionLabels,Morphogens,start_figno) | |||
monitor morphogen levels at a set of vertices | |||
m, mesh | |||
RegionLabels, vertices to be monitored as designated by cell array of strings, i.e. region labels | |||
Morphogens, cell array of strings, i.e. uppercase morphogen names to | |||
be monitored. There should be one RegionLabels string for each | |||
Morphogens string | |||
Vertlabels, if true then display vertex numbers in each region label on | |||
the mesh default false | |||
start_figno, default figure 1 (Must open a fig even if just monitoring to file) | |||
MonData, optional output of data structure | |||
<gallery caption="Measuring growth" widths="300px" heights="300px" perrow="4" border="0"> | <gallery caption="Measuring growth" widths="300px" heights="300px" perrow="4" border="0"> | ||
Image:GPT MeasureGrowth 20121203-000001-0001.png |(A) A single row of vertices (id_mid) labels a line along which measurements will be made. Here, it provides a source for s_mid. | Image:GPT MeasureGrowth 20121203-000001-0001.png |(A) A single row of vertices (id_mid) labels a line along which measurements will be made. Here, it provides a source for s_mid. | ||
Image:GPT MeasureGrowth 20121203-000010-0003.png |(B) Kapar is promoted by s_a. Here, after 10 steps. | Image:GPT MeasureGrowth 20121203-000010-0003.png |(B) Kapar is promoted by s_a. Here, after 10 steps. We are going to view growth along id_mid. | ||
Image:GPT MeasureGrowth 20121203-000010-0002.png|(C) It has been through the interaction function | Image:GPT MeasureGrowth 20121203-000010-0002.png|(C) It has been through the interaction function 10 times. This shows the growth by the time it has reached the end of the 10th pass. Colour shows growth rate over the last time step and lines indicate the major axis. The measurements were computed using '''leaf_computeGrowthFromDisplacements'''(). This display was created by the '''leaf_plotoptions''' function also in the interaction function (see red highlights below) | ||
Image:SpreadsheetGFtboxleaf profile monitor.jpg|(D) | Image:SpreadsheetGFtboxleaf profile monitor.jpg|(D) '''leaf_profile_monitor''' creates an Excel preadsheet showing distances along the line each time the system went through the interaction function. So this actually refers to growth after step 9 - it will go on to compute growth consequent upon this pass. In the sheet shown (the spreadsheet has several), Line 3 displays the time each column was created. Columns (lines 4 to 19) shows the distances of each vertex along i_mid. The spreadsheet is saved to the project snapshots directory. | ||
</gallery> | Image:Interpoint_distances_and_growth.jpg|(E) '''leaf_profile_monitor''' also creates Figures monitoring specified variables. Here the left panel: distances between successive vertices along id_mid. Right panel: growth at each vertex along id_mid. | ||
<br> | </gallery> | ||
<br><br> | |||
<span style="color: CornflowerBlue"></span> | |||
function m = gpt_measuregrowth_20121203( m ) | |||
<span style="color: Green">%m = gpt_measuregrowth_20121203( m )</span> | |||
<span style="color: Green">% Morphogen interaction function.</span> | |||
<span style="color: Green">% Written at 2012-12-04 15:01:27.</span> | |||
<span style="color: Green">% GFtbox revision 4418, .</span> | |||
<span style="color: Green">% The user may edit any part of this function between delimiters</span> | |||
<span style="color: Green">% of the form "USER CODE..." and "END OF USER CODE...". The</span> | |||
<span style="color: Green">% delimiters themselves must not be moved, edited, deleted, or added.</span> | |||
if isempty(m), return; end | |||
fprintf( 1, '<span style="color: Green">%s found in %s\n', mfilename(), which(mfilename()) );</span> | |||
try | |||
m = local_setproperties( m ); | |||
catch | |||
end | |||
realtime = m.globalDynamicProps.currenttime; | |||
<span style="color: CornflowerBlue"></span> | |||
<span style="color: Green">%%% USER CODE: INITIALISATION</span> | |||
<span style="color: Green">%%% END OF USER CODE: INITIALISATION</span> | |||
<span style="color: CornflowerBlue"></span> | |||
<span style="color: Green">%%% SECTION 1: ACCESSING MORPHOGENS AND TIME.</span> | |||
<span style="color: Green">%%% AUTOMATICALLY GENERATED CODE: DO NOT EDIT.</span> | |||
if isempty(m), return; end | |||
setGlobals(); | |||
global gNEW_KA_PAR gNEW_KA_PER gNEW_KB_PAR gNEW_KB_PER | |||
global gNEW_K_NOR gNEW_POLARISER gNEW_STRAINRET gNEW_ARREST | |||
dt = m.globalProps.timestep; | |||
polariser_i = gNEW_POLARISER; | |||
P = m.morphogens(:,polariser_i); | |||
[kapar_i,kapar_p,kapar_a,kapar_l] = getMgenLevels( m, 'KAPAR' ); | |||
[kaper_i,kaper_p,kaper_a,kaper_l] = getMgenLevels( m, 'KAPER' ); | |||
[kbpar_i,kbpar_p,kbpar_a,kbpar_l] = getMgenLevels( m, 'KBPAR' ); | |||
[kbper_i,kbper_p,kbper_a,kbper_l] = getMgenLevels( m, 'KBPER' ); | |||
[knor_i,knor_p,knor_a,knor_l] = getMgenLevels( m, 'KNOR' ); | |||
[strainret_i,strainret_p,strainret_a,strainret_l] = getMgenLevels( m, 'STRAINRET' ); | |||
[arrest_i,arrest_p,arrest_a,arrest_l] = getMgenLevels( m, 'ARREST' ); | |||
[id_mid_i,id_mid_p,id_mid_a,id_mid_l] = getMgenLevels( m, 'ID_MID' ); | |||
[s_mid_i,s_mid_p,s_mid_a,s_mid_l] = getMgenLevels( m, 'S_MID' ); | |||
<span style="color: Green">% Mesh type: rectangle</span> | |||
<span style="color: Green">% base: 0</span> | |||
<span style="color: Green">% centre: 0</span> | |||
<span style="color: Green">% randomness: 0.1</span> | |||
<span style="color: Green">% version: 1</span> | |||
<span style="color: Green">% xdivs: 16</span> | |||
<span style="color: Green">% xwidth: 2</span> | |||
<span style="color: Green">% ydivs: 16</span> | |||
<span style="color: Green">% ywidth: 2</span> | |||
<span style="color: Green">% Morphogen Diffusion Decay Dilution Mutant</span> | |||
<span style="color: Green">% --------------------------------------------------</span> | |||
<span style="color: Green">% KAPAR ---- ---- ---- ----</span> | |||
<span style="color: Green">% KAPER ---- ---- ---- ----</span> | |||
<span style="color: Green">% KBPAR ---- ---- ---- ----</span> | |||
<span style="color: Green">% KBPER ---- ---- ---- ----</span> | |||
<span style="color: Green">% KNOR ---- ---- ---- ----</span> | |||
<span style="color: Green">% POLARISER ---- ---- ---- ----</span> | |||
<span style="color: Green">% STRAINRET ---- ---- ---- ----</span> | |||
<span style="color: Green">% ARREST ---- ---- ---- ----</span> | |||
<span style="color: Green">% ID_MID ---- ---- ---- ----</span> | |||
<span style="color: Green">% S_MID 0.01 ---- ---- ----</span> | |||
<span style="color: Green">%%% USER CODE: MORPHOGEN INTERACTIONS</span> | |||
if (Steps(m)==0) && m.globalDynamicProps.doinit <span style="color: Green">% Initialisation code.</span> | |||
<span style="color: Green">% assign a morphogen down the middle of the y axis</span> | |||
id_mid_p((m.nodes(:,2)<0.1)&(m.nodes(:,2)>-0.1))=1; | |||
s_mid_p(:)=0; | |||
s_mid_p=id_mid_p; | |||
m.morphogenclamp( (id_mid_p==1), s_mid_i ) = 1; | |||
m = leaf_mgen_conductivity( m, 's_mid', 0.01 ); <span style="color: Green">%specifies the diffusion rate of polariser </span> | |||
m = leaf_mgen_absorption( m, 's_mid', 0.0 ); <span style="color: Green">% specifies degradation rate of polariser</span> | |||
end | |||
kapar_p=15 * pro(1,s_mid_p); | |||
kbpar_p=15 * pro(1,s_mid_p); | |||
kaper_p=10 * pro(1,s_mid_p); | |||
kbper_p=10 * pro(1,s_mid_p); | |||
knor_p =0; | |||
<span style="color: Green">% calculate growth over dt interval</span> | |||
if isfield(m.userdata,'oldpos') | |||
displacements = m.prismnodes - m.userdata.oldpos; | |||
<span style="color: Red">[growth,gf] = leaf_computeGrowthFromDisplacements( m, displacements, ... | |||
realtime - m.userdata.starttime,'axisorder', 'maxminnor', ... | |||
'anisotropythreshold', 0.05);</span> | |||
<span style="color: Green">% plot resultant areal growth rates over dt (i.e. one step).</span> | |||
<span style="color: Red">m = leaf_plotoptions( m, 'pervertex',perFEtoperVertex(m,sum(growth(:,1:2),2)) ,'perelementaxes', gf(:,1,:), 'drawtensoraxes', true );</span> | |||
<span style="color: Green">% monitor properties of vertices must be done here - so that it reports newly equilibrated levels</span> | |||
end | |||
m.userdata.oldpos = m.prismnodes; | |||
m.userdata.starttime = realtime; | |||
<span style="color: Green">% monitor growth in a Figure and write excel file</span> | |||
<span style="color: Red">[m,MonData]=leaf_profile_monitor(m,... <span style="color: Green">% essential</span> | |||
'REGIONLABELS',{'ID_MID'},... <span style="color: Green">% essential</span> | |||
'VERTLABELS',false,'FigNum',1,'EXCEL',true);</span> <span style="color: Green">% optional (file in snapshots directory')</span> | |||
<span style="color: Green">% if sum(ismember(output,realtime)) && m.userdata.output ==1</span> | |||
<span style="color: Green">% % Output - plot an image at high resolution </span> | |||
<span style="color: Green">% path = fileparts(which(m.globalProps.modelname));</span> | |||
<span style="color: Green">% [m,ok] = leaf_snapshot( m,[path,filesep,'snapshots',filesep,modelname,'_',modeltype,'.png'], 'resolution',[]); %</span> | |||
<span style="color: Green">% </span> | |||
<span style="color: Green">% end</span> | |||
<span style="color: CornflowerBlue"></span> | |||
<span style="color: Green">%%% END OF USER CODE: MORPHOGEN INTERACTIONS</span> | |||
<span style="color: Green">%%% SECTION 3: INSTALLING MODIFIED VALUES BACK INTO MESH STRUCTURE</span> | |||
<span style="color: Green">%%% AUTOMATICALLY GENERATED CODE: DO NOT EDIT.</span> | |||
m.morphogens(:,polariser_i) = P; | |||
m.morphogens(:,kapar_i) = kapar_p; | |||
m.morphogens(:,kaper_i) = kaper_p; | |||
m.morphogens(:,kbpar_i) = kbpar_p; | |||
m.morphogens(:,kbper_i) = kbper_p; | |||
m.morphogens(:,knor_i) = knor_p; | |||
m.morphogens(:,strainret_i) = strainret_p; | |||
m.morphogens(:,arrest_i) = arrest_p; | |||
m.morphogens(:,id_mid_i) = id_mid_p; | |||
m.morphogens(:,s_mid_i) = s_mid_p; | |||
<span style="color: Green">%%% USER CODE: FINALISATION</span> | |||
<span style="color: Green">%%% END OF USER CODE: FINALISATION</span> | |||
end | |||
Latest revision as of 10:44, 6 December 2012
Measuring growth of a model
Download a project illustrating measurements GPT_MeasureGrowth_20121203
The GPT_MeasureGrowth_20121203 interaction function is shown at the bottom of this page.
There are several ways to measure growth on the model. For example, there are two auxiliary functions:
[out1, out2, out3, out4] = leaf_computeGrowthFromDisplacements( m, displacements, time, ... )
   Compute the growth rate in each FE of m given the displacements of all
   the prism nodes and the time over which these displacements happened.
   This assumes that m is in the state after these
   displacements have happened.  The results returned depend on the
   options and on how many output arguments are given.  Note that unlike
   most leaf_* commands, m itself is not one of the output arguments,
   since this procedure does not need to modify m.
function  m=leaf_profile_monitor(m,realtime,RegionLabels,Morphogens,start_figno)
monitor morphogen levels at a set of vertices
m, mesh
RegionLabels, vertices to be monitored as designated by cell array of strings, i.e. region labels
Morphogens, cell array of strings, i.e. uppercase morphogen names to
   be monitored. There should be one RegionLabels string for each
   Morphogens string
Vertlabels, if true then display vertex numbers in each region label on
         the mesh default false
start_figno, default figure 1 (Must open a fig even if just monitoring to file)

MonData, optional output of data structure
- Measuring growth
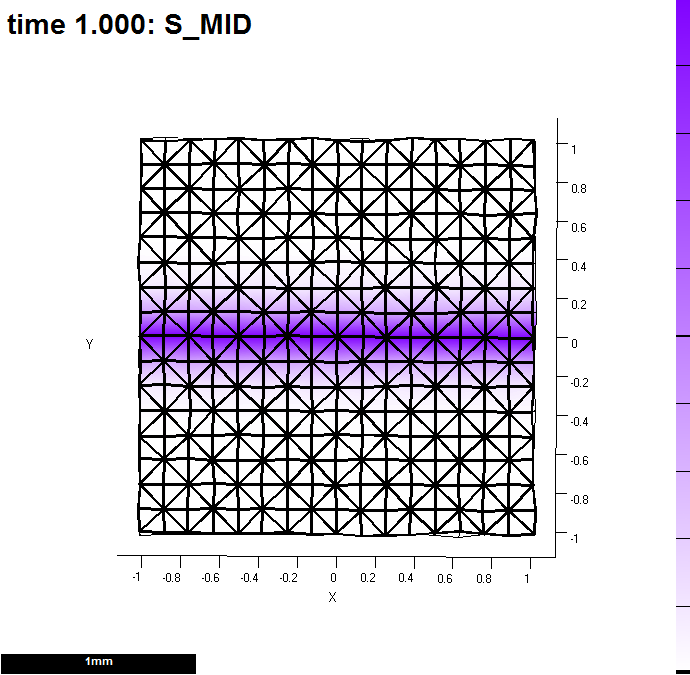
(A) A single row of vertices (id_mid) labels a line along which measurements will be made. Here, it provides a source for s_mid.
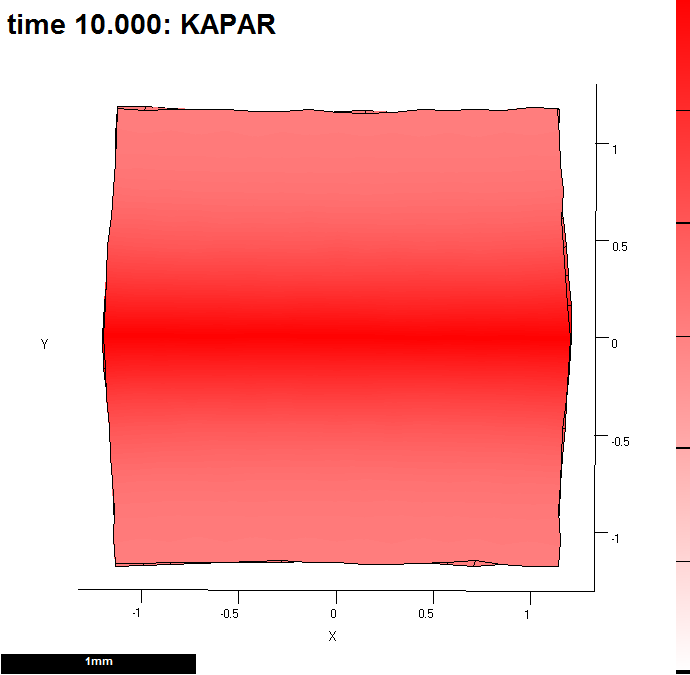
(B) Kapar is promoted by s_a. Here, after 10 steps. We are going to view growth along id_mid.
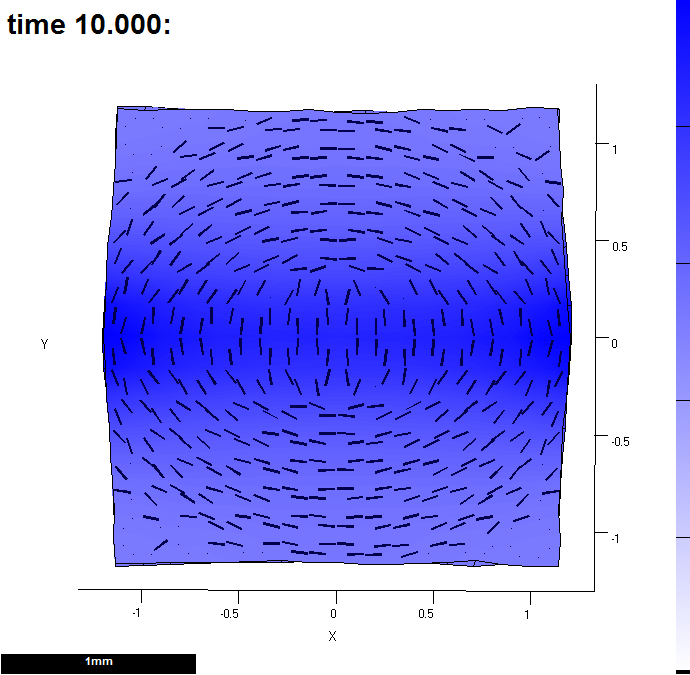
(C) It has been through the interaction function 10 times. This shows the growth by the time it has reached the end of the 10th pass. Colour shows growth rate over the last time step and lines indicate the major axis. The measurements were computed using leaf_computeGrowthFromDisplacements(). This display was created by the leaf_plotoptions function also in the interaction function (see red highlights below)
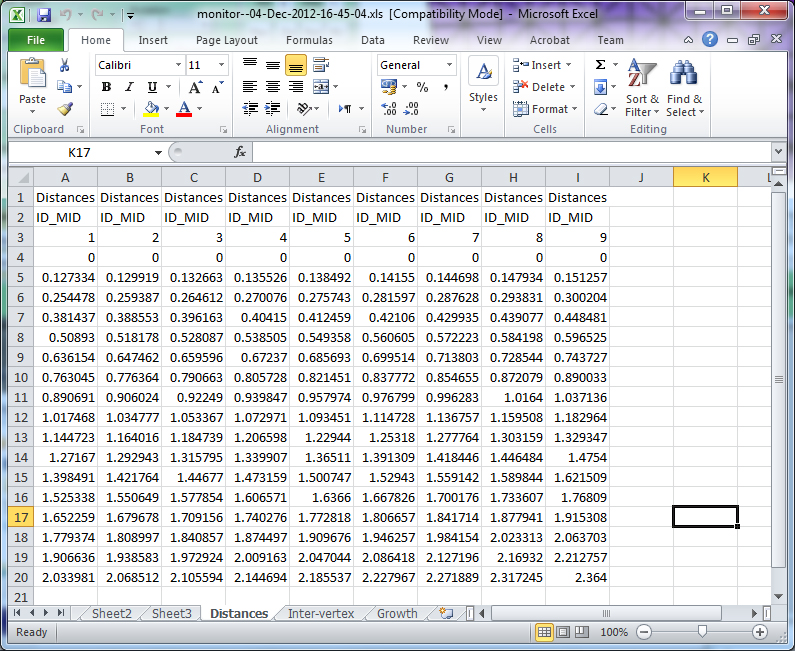
(D) leaf_profile_monitor creates an Excel preadsheet showing distances along the line each time the system went through the interaction function. So this actually refers to growth after step 9 - it will go on to compute growth consequent upon this pass. In the sheet shown (the spreadsheet has several), Line 3 displays the time each column was created. Columns (lines 4 to 19) shows the distances of each vertex along i_mid. The spreadsheet is saved to the project snapshots directory.
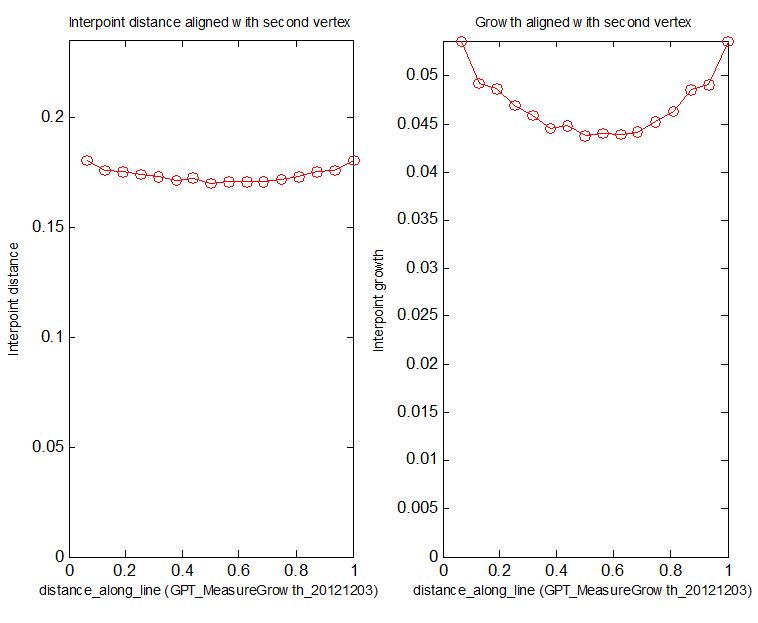
(E) leaf_profile_monitor also creates Figures monitoring specified variables. Here the left panel: distances between successive vertices along id_mid. Right panel: growth at each vertex along id_mid.


function m = gpt_measuregrowth_20121203( m )
%m = gpt_measuregrowth_20121203( m )
%   Morphogen interaction function.
%   Written at 2012-12-04 15:01:27.
%   GFtbox revision 4418, .

% The user may edit any part of this function between delimiters
% of the form "USER CODE..." and "END OF USER CODE...".  The
% delimiters themselves must not be moved, edited, deleted, or added.

    if isempty(m), return; end

    fprintf( 1, '%s found in %s\n', mfilename(), which(mfilename()) );

    try
        m = local_setproperties( m );
    catch
    end

    realtime = m.globalDynamicProps.currenttime;


%%% USER CODE: INITIALISATION

%%% END OF USER CODE: INITIALISATION


%%% SECTION 1: ACCESSING MORPHOGENS AND TIME.
%%% AUTOMATICALLY GENERATED CODE: DO NOT EDIT.

    if isempty(m), return; end

    setGlobals();
    global gNEW_KA_PAR gNEW_KA_PER gNEW_KB_PAR gNEW_KB_PER
    global gNEW_K_NOR gNEW_POLARISER gNEW_STRAINRET gNEW_ARREST
    dt = m.globalProps.timestep;
    polariser_i = gNEW_POLARISER;
    P = m.morphogens(:,polariser_i);
    [kapar_i,kapar_p,kapar_a,kapar_l] = getMgenLevels( m, 'KAPAR' );
    [kaper_i,kaper_p,kaper_a,kaper_l] = getMgenLevels( m, 'KAPER' );
    [kbpar_i,kbpar_p,kbpar_a,kbpar_l] = getMgenLevels( m, 'KBPAR' );
    [kbper_i,kbper_p,kbper_a,kbper_l] = getMgenLevels( m, 'KBPER' );
    [knor_i,knor_p,knor_a,knor_l] = getMgenLevels( m, 'KNOR' );
    [strainret_i,strainret_p,strainret_a,strainret_l] = getMgenLevels( m, 'STRAINRET' );
    [arrest_i,arrest_p,arrest_a,arrest_l] = getMgenLevels( m, 'ARREST' );
    [id_mid_i,id_mid_p,id_mid_a,id_mid_l] = getMgenLevels( m, 'ID_MID' );
    [s_mid_i,s_mid_p,s_mid_a,s_mid_l] = getMgenLevels( m, 'S_MID' );

% Mesh type: rectangle
%            base: 0
%          centre: 0
%      randomness: 0.1
%         version: 1
%           xdivs: 16
%          xwidth: 2
%           ydivs: 16
%          ywidth: 2

%            Morphogen    Diffusion   Decay   Dilution   Mutant
%            --------------------------------------------------
%                KAPAR         ----    ----       ----     ----
%                KAPER         ----    ----       ----     ----
%                KBPAR         ----    ----       ----     ----
%                KBPER         ----    ----       ----     ----
%                 KNOR         ----    ----       ----     ----
%            POLARISER         ----    ----       ----     ----
%            STRAINRET         ----    ----       ----     ----
%               ARREST         ----    ----       ----     ----
%               ID_MID         ----    ----       ----     ----
%                S_MID         0.01    ----       ----     ----


%%% USER CODE: MORPHOGEN INTERACTIONS

    if (Steps(m)==0) && m.globalDynamicProps.doinit  % Initialisation code.
        % assign a morphogen down the middle of the y axis
        id_mid_p((m.nodes(:,2)<0.1)&(m.nodes(:,2)>-0.1))=1;
        s_mid_p(:)=0;
        s_mid_p=id_mid_p;
        m.morphogenclamp( (id_mid_p==1), s_mid_i ) = 1;
        m = leaf_mgen_conductivity( m, 's_mid', 0.01 );  %specifies the diffusion rate of polariser
        m = leaf_mgen_absorption( m, 's_mid', 0.0 );     % specifies degradation rate of polariser
    end
        kapar_p=15 * pro(1,s_mid_p);
        kbpar_p=15 * pro(1,s_mid_p);
        kaper_p=10 * pro(1,s_mid_p);
        kbper_p=10 * pro(1,s_mid_p);
        knor_p =0;
    % calculate growth over dt interval
    if isfield(m.userdata,'oldpos')
        displacements = m.prismnodes - m.userdata.oldpos;
        [growth,gf] = leaf_computeGrowthFromDisplacements( m, displacements, ...
            realtime - m.userdata.starttime,'axisorder', 'maxminnor', ...
            'anisotropythreshold', 0.05);
        % plot resultant areal growth rates over dt (i.e. one step).
        m = leaf_plotoptions( m, 'pervertex',perFEtoperVertex(m,sum(growth(:,1:2),2)) ,'perelementaxes', gf(:,1,:), 'drawtensoraxes', true );
        % monitor properties of vertices must be done here - so that it reports newly equilibrated levels
    end
    m.userdata.oldpos = m.prismnodes;
    m.userdata.starttime = realtime;
    % monitor growth in a Figure and write excel file
    [m,MonData]=leaf_profile_monitor(m,... % essential
        'REGIONLABELS',{'ID_MID'},... % essential
        'VERTLABELS',false,'FigNum',1,'EXCEL',true); % optional (file in snapshots directory')

% if sum(ismember(output,realtime)) && m.userdata.output ==1
%     % Output - plot an image at high resolution
%     path = fileparts(which(m.globalProps.modelname));
%     [m,ok] = leaf_snapshot( m,[path,filesep,'snapshots',filesep,modelname,'_',modeltype,'.png'], 'resolution',[]); %
%
% end

%%% END OF USER CODE: MORPHOGEN INTERACTIONS

%%% SECTION 3: INSTALLING MODIFIED VALUES BACK INTO MESH STRUCTURE
%%% AUTOMATICALLY GENERATED CODE: DO NOT EDIT.
    m.morphogens(:,polariser_i) = P;
    m.morphogens(:,kapar_i) = kapar_p;
    m.morphogens(:,kaper_i) = kaper_p;
    m.morphogens(:,kbpar_i) = kbpar_p;
    m.morphogens(:,kbper_i) = kbper_p;
    m.morphogens(:,knor_i) = knor_p;
    m.morphogens(:,strainret_i) = strainret_p;
    m.morphogens(:,arrest_i) = arrest_p;
    m.morphogens(:,id_mid_i) = id_mid_p;
    m.morphogens(:,s_mid_i) = s_mid_p;

%%% USER CODE: FINALISATION

%%% END OF USER CODE: FINALISATION

end