One dimensional sieve introduction: Difference between revisions
Jump to navigation
Jump to search
No edit summary |
No edit summary |
||
| Line 1: | Line 1: | ||
[http://cmpdartsvr3.cmp.uea.ac.uk/wiki/BanghamLab/index.php/MSER%27s_and_Connected_sets#One_dimensional_signals Return to MSERs and extrema]<br><br> | [http://cmpdartsvr3.cmp.uea.ac.uk/wiki/BanghamLab/index.php/MSER%27s_and_Connected_sets#One_dimensional_signals Return to MSERs and extrema]<br><br> | ||
=<span style="color:Chocolate">1D Signals</span>= | |||
Matlab function IllustrateSIV_1 illustrates how MSERs (maximally stable extremal regions) and sieves are related. We start with one dimensional signals before moving to two dimensional images and three dimensional volumes. | Matlab function IllustrateSIV_1 illustrates how MSERs (maximally stable extremal regions) and sieves are related. We start with one dimensional signals before moving to two dimensional images and three dimensional volumes. | ||
{| border="0" cellpadding="5" cellspacing="5" | {| border="0" cellpadding="5" cellspacing="5" | ||
| Line 13: | Line 14: | ||
|} | |} | ||
<math>X</math> has three one-sample-wide maxima (<math>M^1_8</math> , <math>M^1_{24}</math> , <math>M^1_{29}</math> ), two two-sample-wide maxima (<math>M^2_{14}</math> , <math>M^2_{21}</math>) some of which, when removed, will persist as larger scale maxima, e.g. <math>M^1_{24}</math> will become two samples wide as the peak is clipped off. | <math>X</math> has three one-sample-wide maxima (<math>M^1_8</math> , <math>M^1_{24}</math> , <math>M^1_{29}</math> ), two two-sample-wide maxima (<math>M^2_{14}</math> , <math>M^2_{21}</math>) some of which, when removed, will persist as larger scale maxima, e.g. <math>M^1_{24}</math> will become two samples wide as the peak is clipped off. | ||
=<span style="color:Chocolate">Filter</span>= | |||
Revision as of 20:35, 14 November 2013
1D Signals
Matlab function IllustrateSIV_1 illustrates how MSERs (maximally stable extremal regions) and sieves are related. We start with one dimensional signals before moving to two dimensional images and three dimensional volumes.
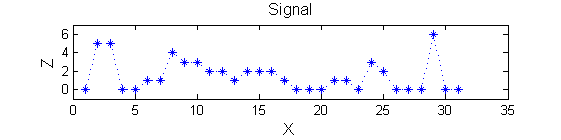
| Consider a signal, <math>X</math> X=getData('PULSES3WIDE') |

<math>X</math> has three one-sample-wide maxima (<math>M^1_8</math> , <math>M^1_{24}</math> , <math>M^1_{29}</math> ), two two-sample-wide maxima (<math>M^2_{14}</math> , <math>M^2_{21}</math>) some of which, when removed, will persist as larger scale maxima, e.g. <math>M^1_{24}</math> will become two samples wide as the peak is clipped off.