SectorAnalysisToolbox Documentation
The models shown in these tutorials illustrate features of the SectorAnalysisToolbox software. Viewing these pages. Some versions of Firefox and Explorer do not create satisfactory prints even though you can view the pages with no problems. Chrome does appear to produce good printouts.
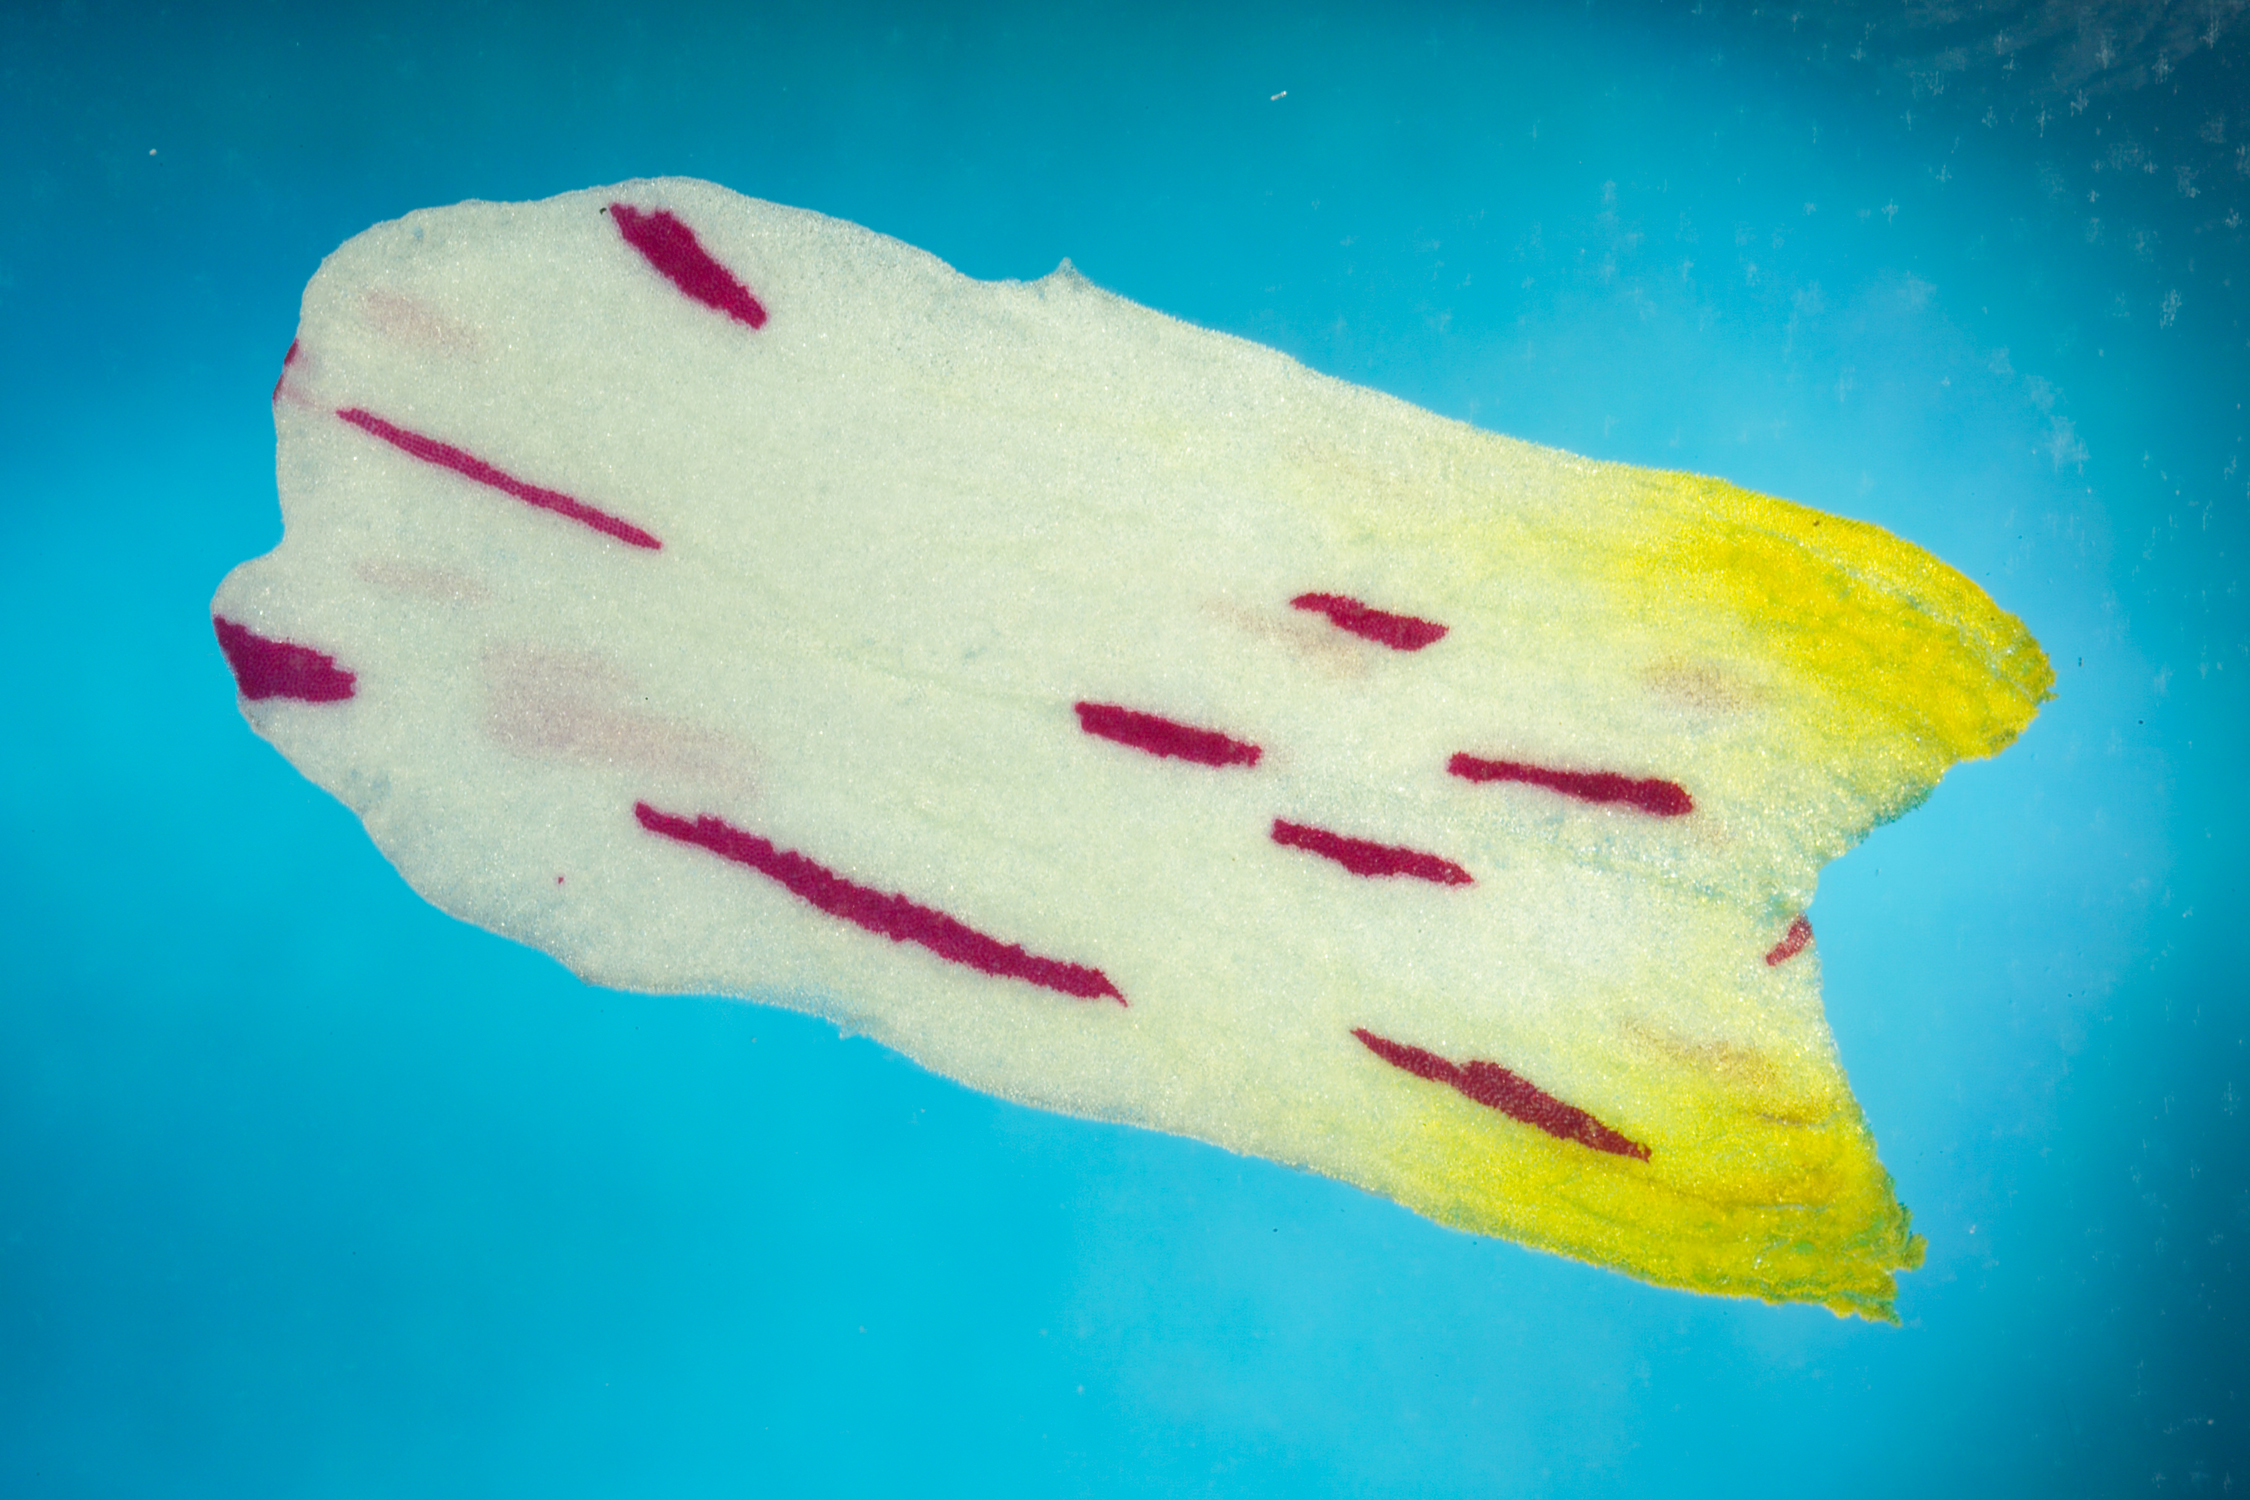
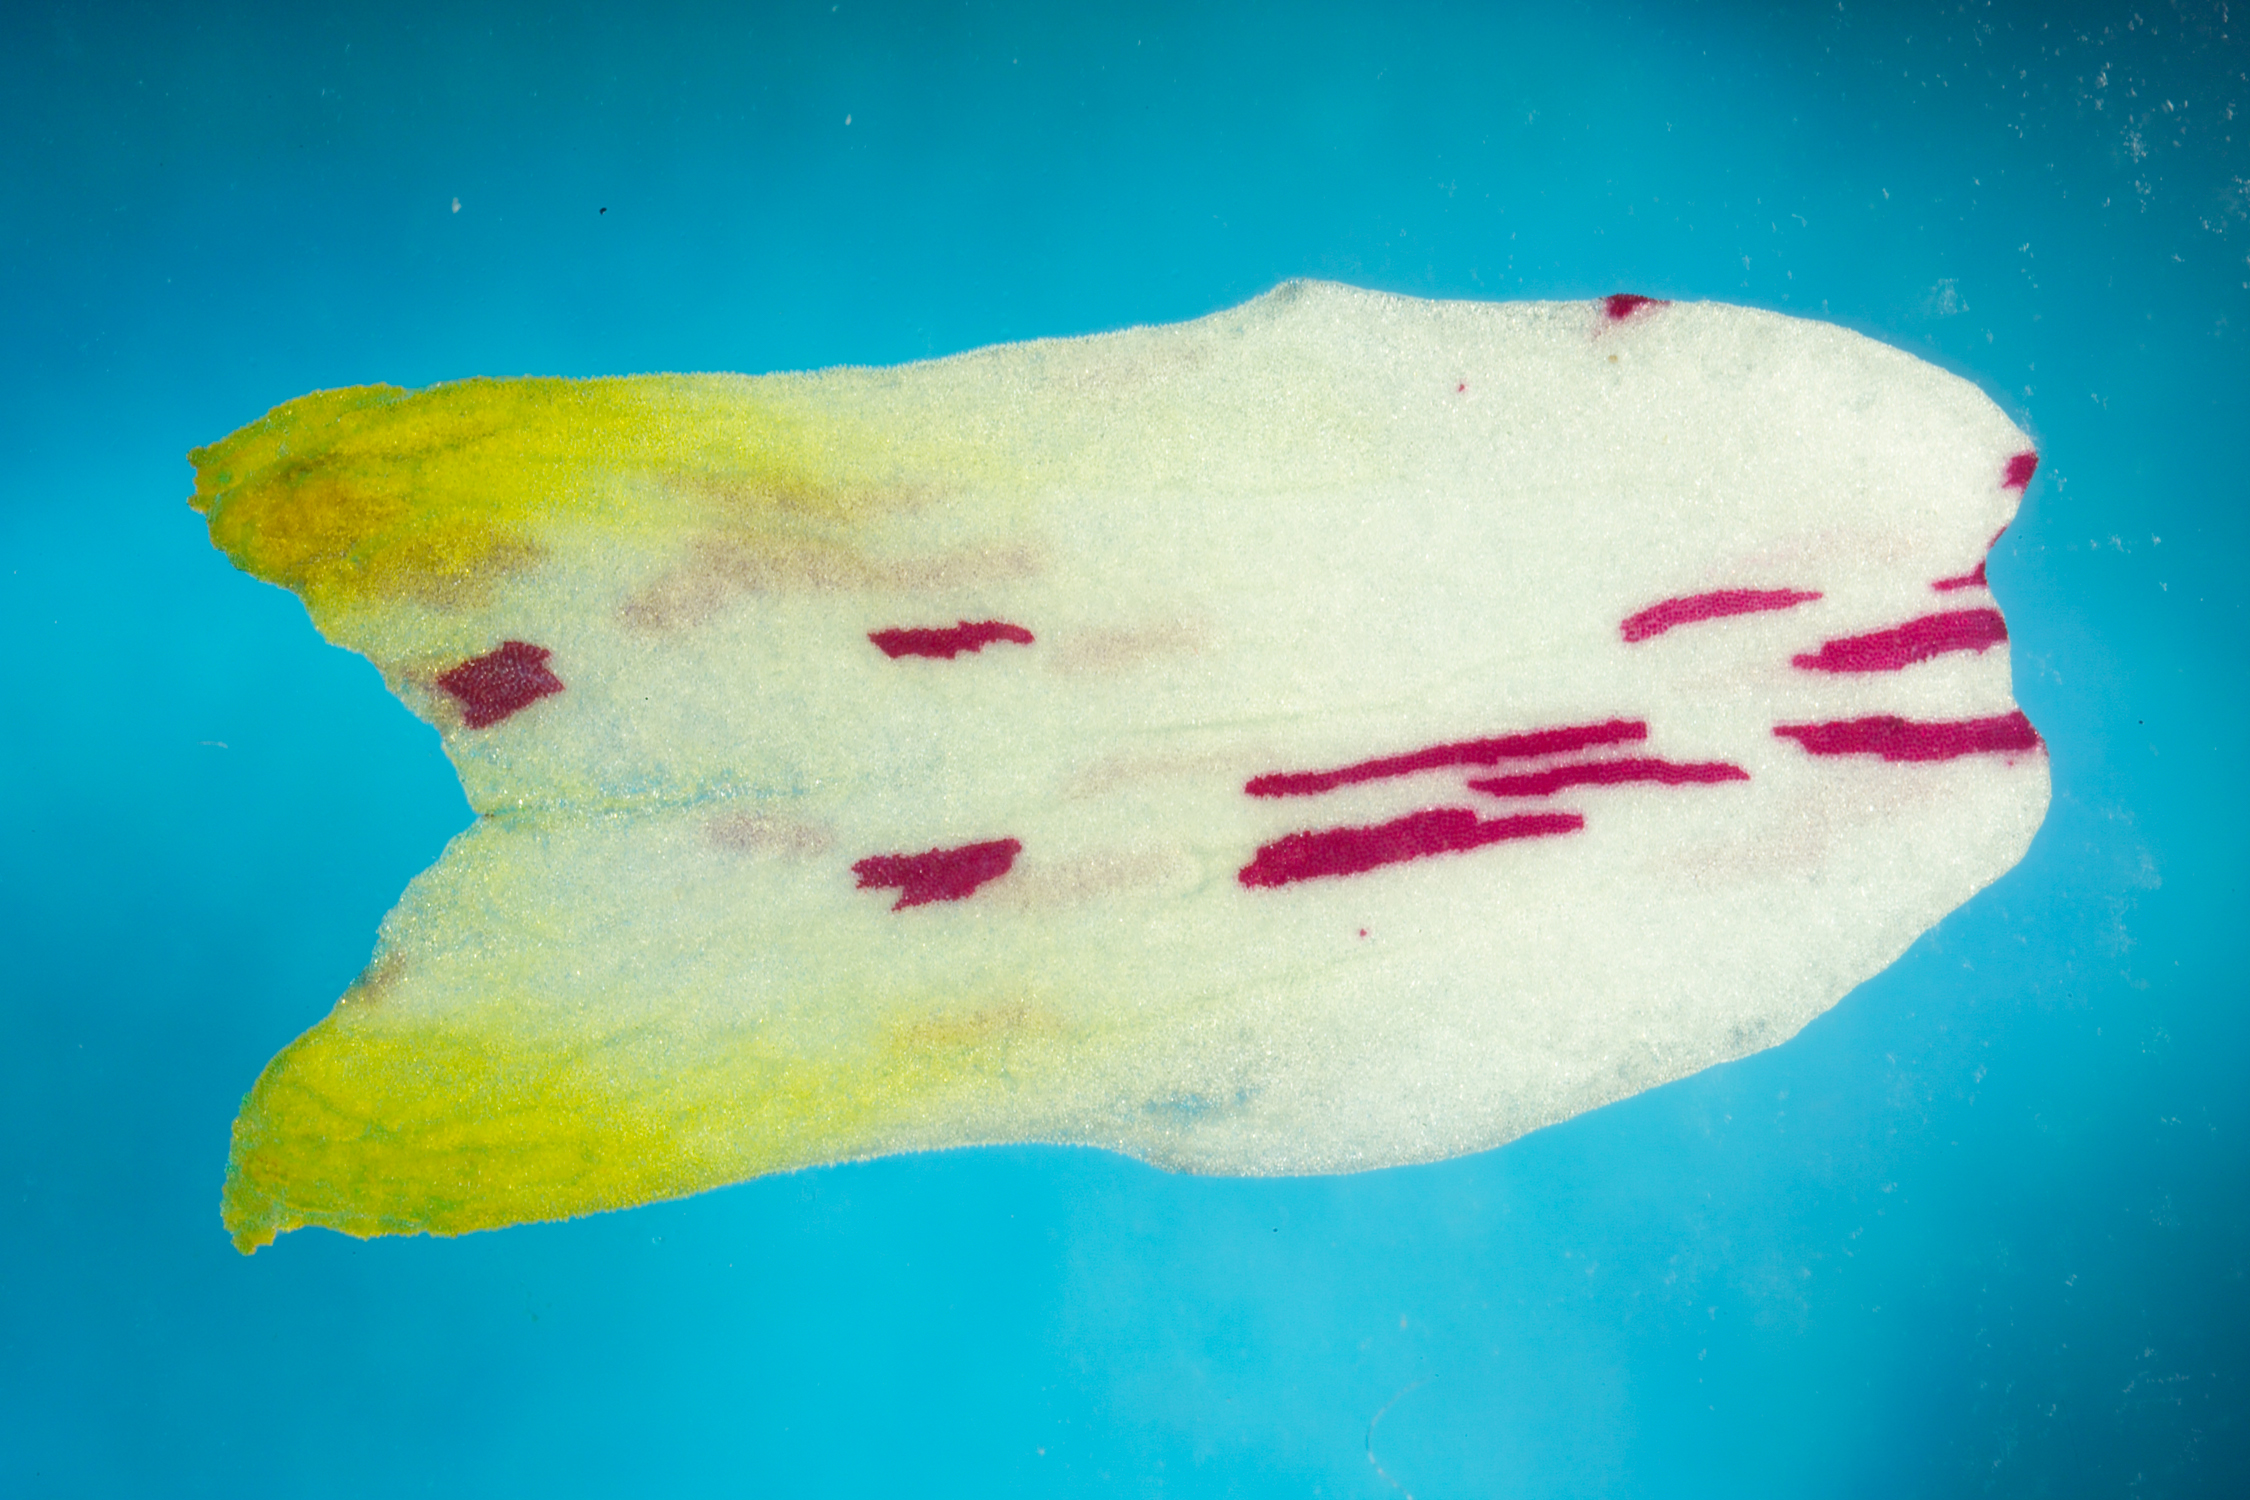
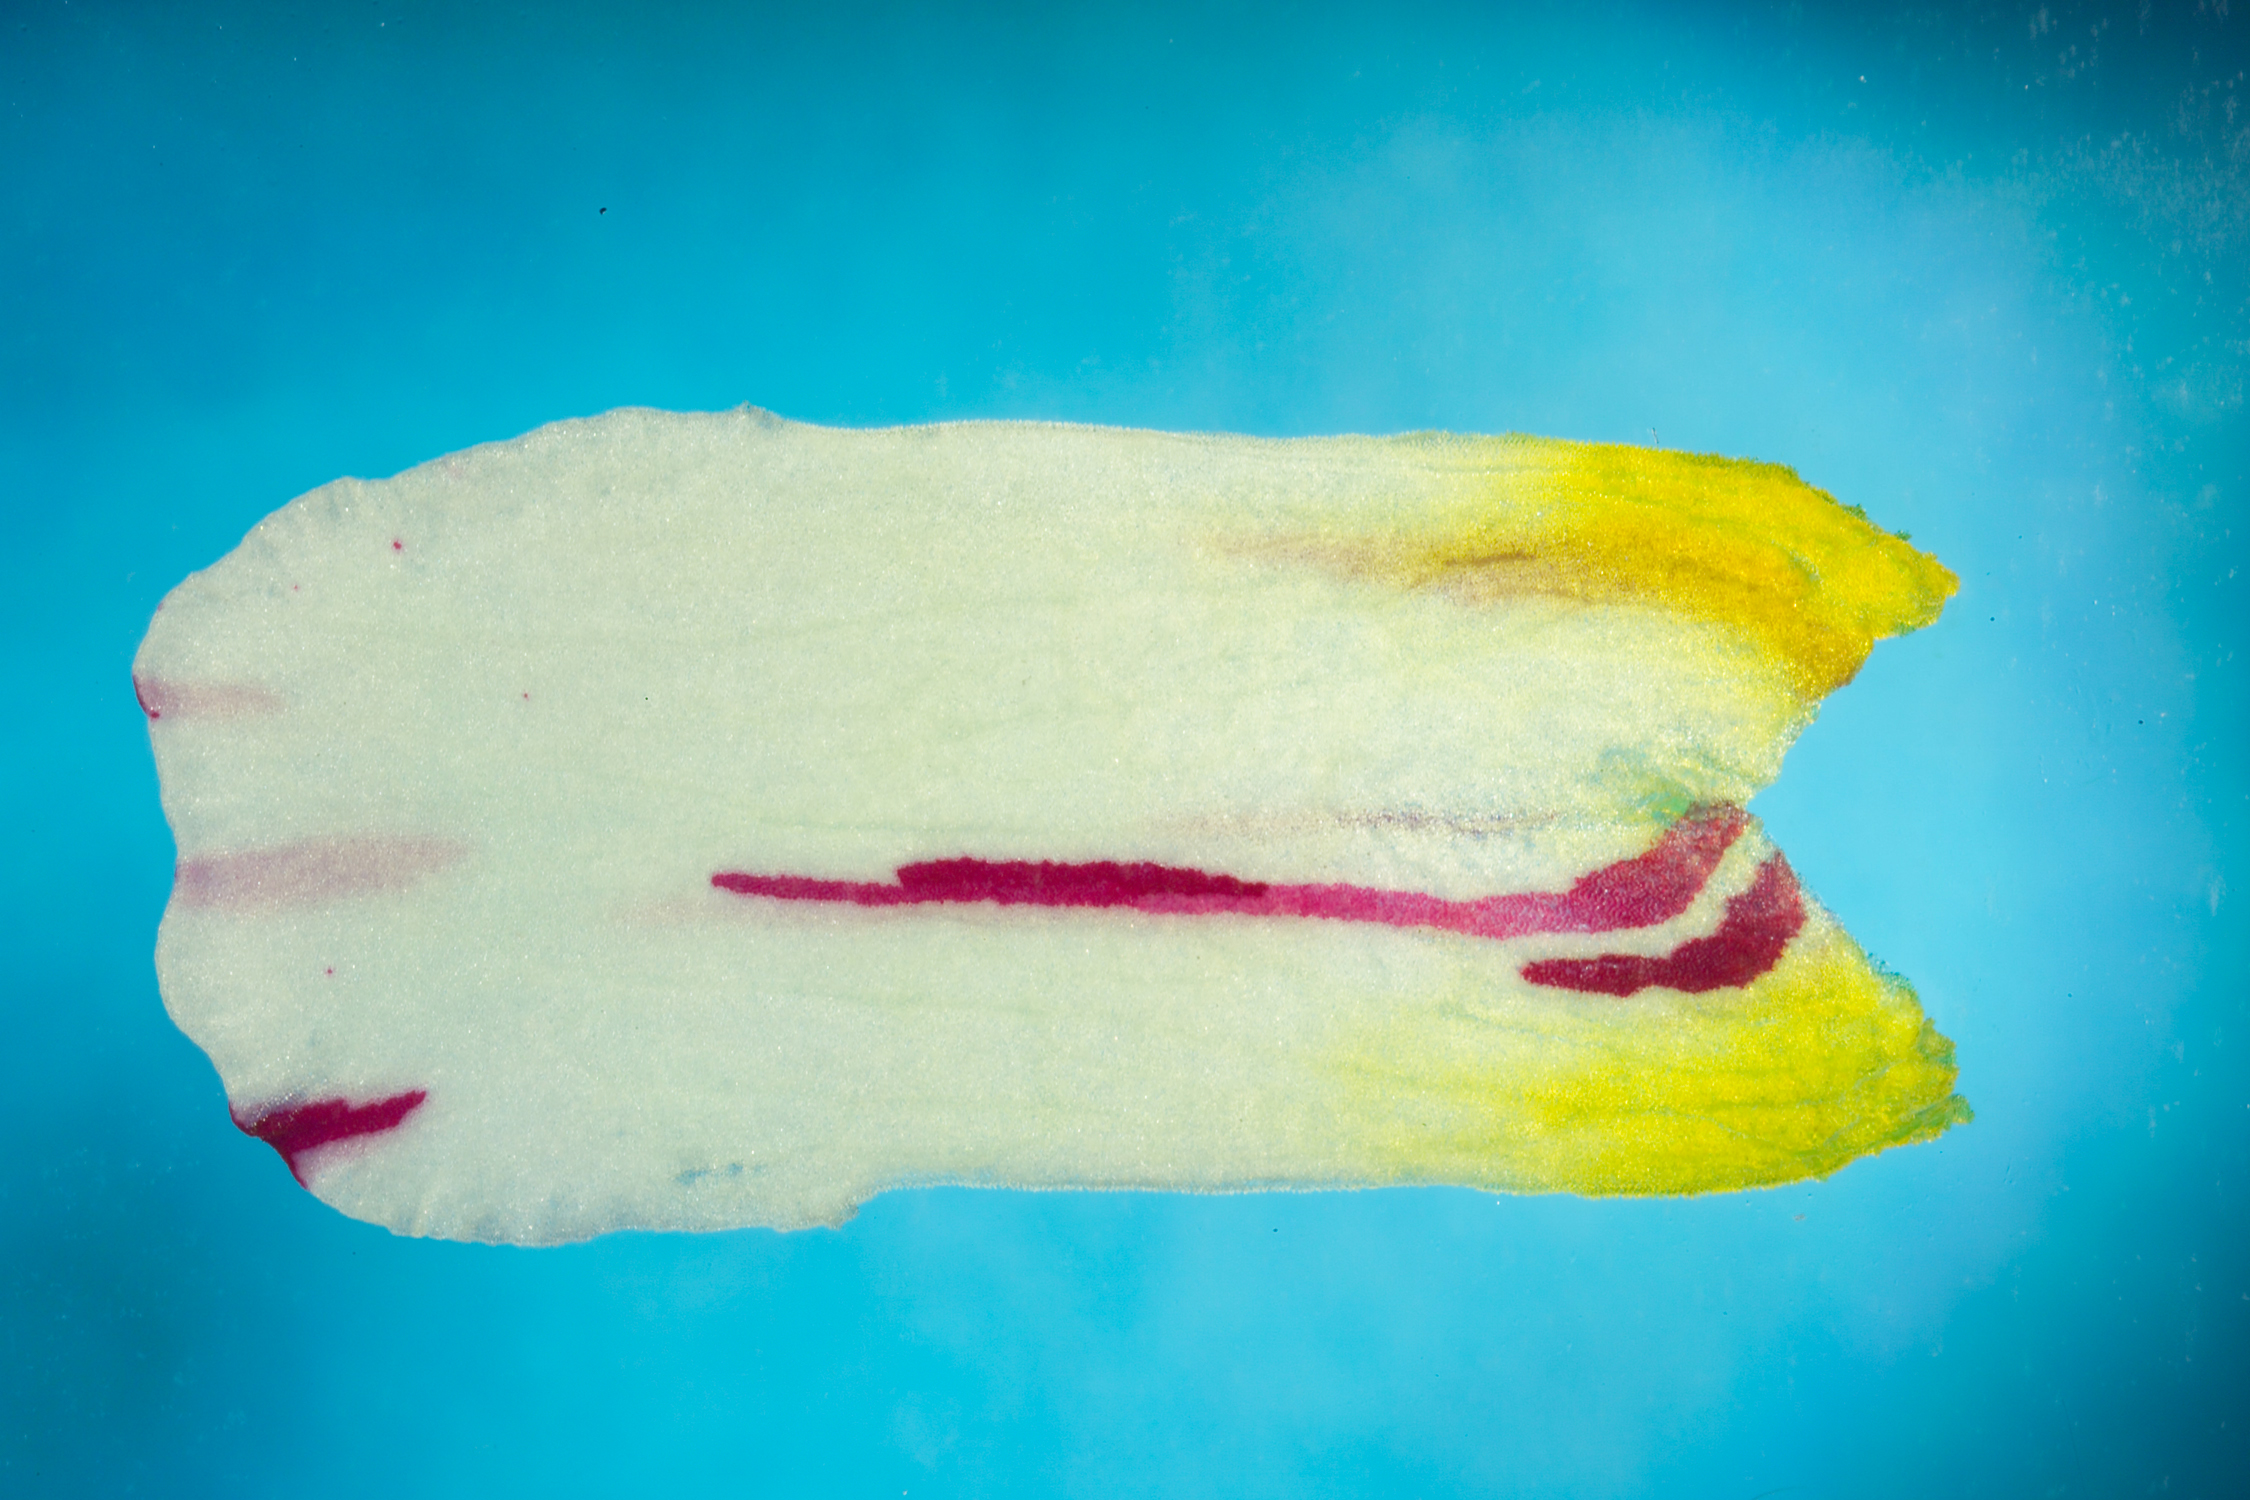
Analysing the shapes of cell clones in Antirrhinum petals
How to use the tutorial. First download and install the SectorAnalysisToolbox . Then, from Matlab, change directory into the project and launch the SectorAnalysisToolbox.
- antirrhinum petals sample data


1 Creating a new project
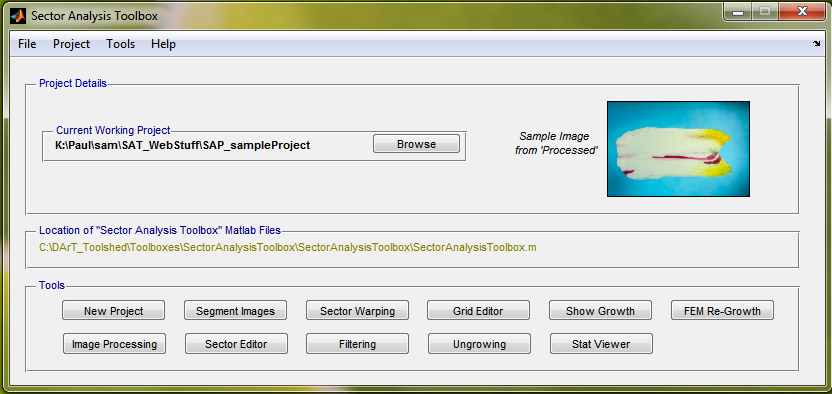
To create a new project, click the New Project button and name your project when prompted. The toolbox automatically gives each project the prefix ‘SAP_’ (Sector Analysis Project). The project directory structure will be saved to disk and contains the folders Original, Processed and Staged. Copy the sample antirrhinum images (P9F17P1I.JPG, P9F17P2I.JPG, P10F17P1I.JPG) into the Staged dir.
Once a project has been created, you can return to that project either by selecting that project in the Current Directory line at the top of the Matlab window, or by opening the toolbox and using the Browse button to select your project.
- SAT main window

2 Segmenting the petal and clones
So far, we have created a new project and populated it with some sample antirrhinum petal images. We would now like to automatically segment the antirrhinum petal and the purple sectors.
Click the button Segment Images. A dialog box will ask the user to select a segmentation algorithm. Select amelia_petal_sectors.m from the drop down box as this segmentation algorithm is specifically designed to work with our data. The SAT will look in the Staged directory for *.jpg imaged to segment. A dialog box will ask the user which images to segment - in this case we will use the Select All button. A task bar indicates segmentation progress. When an image has been segmented, the image file in the Staged folder is replaced by a folder with containing a matlab file called edge_xy (the organ outline coordinates), a .jpg snapshot of the original image, a .tif black and white (binary) image with the suffix _organ (corresponding to the petal/leaf outline), and a .tif binary image with the suffix _sectors (corresponding to the sectors).
- The original image (left) segmented petal (centre) and segmented clones (right)


3 Editing the Segmented clones and organ edges
So far, we have used automated segmentation algorithms to segment petals and sectors within the petals. We would now like to view the results and if necessary perform any manual editing.
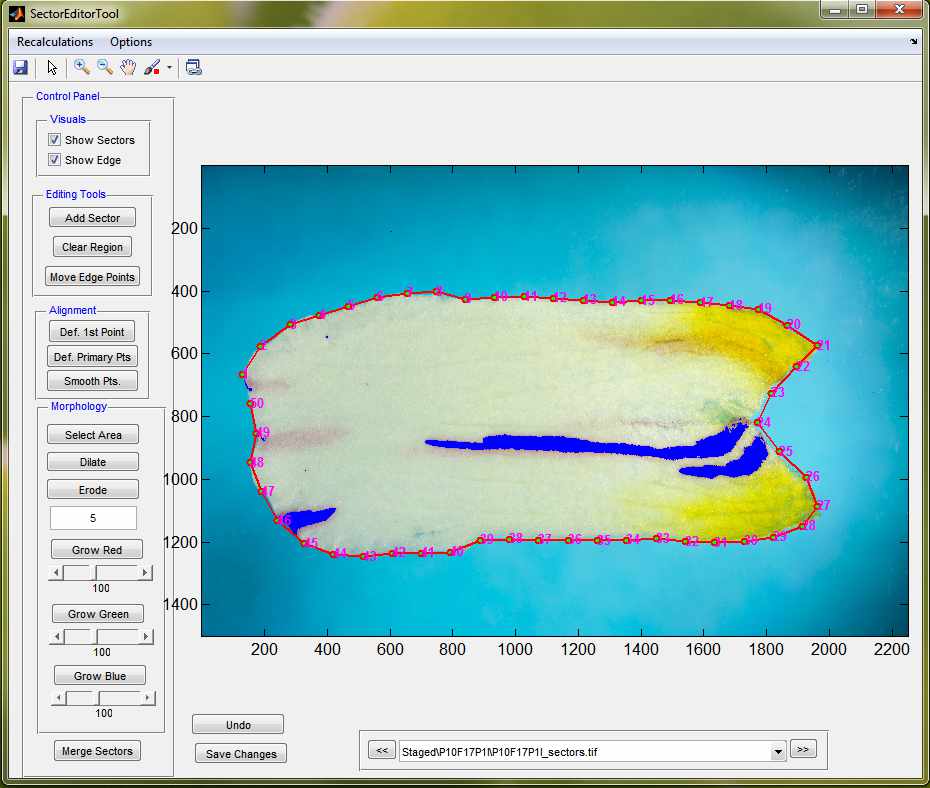
Click Sector Editor to open the Sector Editor Tool. The first image from the Staged folder should be displayed in this window. The outline of the petal section is marked by 50 edge points joined by a red line. Edge information are provided by the edge_xy.mat file and filename_organ.tif. The latter shows the organ shape as a binary (black and white) image. The file filename_sectors.tif is openend (the segemented out sectors) to superimpose the sectors on the image in blue. The boxes Show Sectors and Show Edge can be toggled to show or hide the edge outline and the sector pattern found by the computer. The tools at the top of the window can be used to zoom into, pan around and rotate the image (standard symbols are used for each function). Edges can be moved using the Move Edge Points button. To smooth the edges, click on Def. primary points and select at least 2 primaries (for example tip and base: these must correspond to the same number and the same morphological feature for each image). Then click smooth pts, all the edge points will be smoothed around the 2 fixed primaries (these will not move). It is important that the edges are consistent from one image to another as they will be used to calculate the mean shape and the warping of the sectors. When the edge points are judged to capture the petal outline satisfactorily, the same button (now named Save New Edge) should be clicked to save the edited outline under edge_xy.mat. The primary points are saved under primary_landmarks.mat.
The rest of the tools can be used to edit the sectors. The superimposed blue sectors should be found in the same places as the red sectors on the petal image. If there is no blue sector where there is a red sector, the sector can be drawn in by clicking Add Sector, then clicking around a polygon (double click to finish) of the correct shape and size where you want the sector to be. If there is a blue sector where there is no red sector, the erroneous sector can be removed by clicking Clear Region, then drawing a box around sectors to be removed (double click to finish). If two or more blue sectors are found across the area of one red sector, the sectors can be joined by clicking Merge Sectors. This makes the image window into a black and white image of the sectors (white) against a black background. Click once in each sector and then press Enter to fill in the gaps between the sectors so they appear as one sector. Any changes that have been made to the sectors should be saved by clicking Save Changes. Clicking Undo will revert to the previous saved sector pattern.
To move onto another image, either click the >> or << arrows below the image window to go one forward in the list or one back in the list, or click the downward arrow beside the list to select any image from the Staged folder.
- SectorEditor

4 Sector and Organ warping
In this section we are going to use our three segmented petal outlines to calculate a mean petal shape. Then we are going to warp the segmented sectors onto the mean shape.
Select the Sector Warping button. This opens a new window entitled Sector Warping Tool.
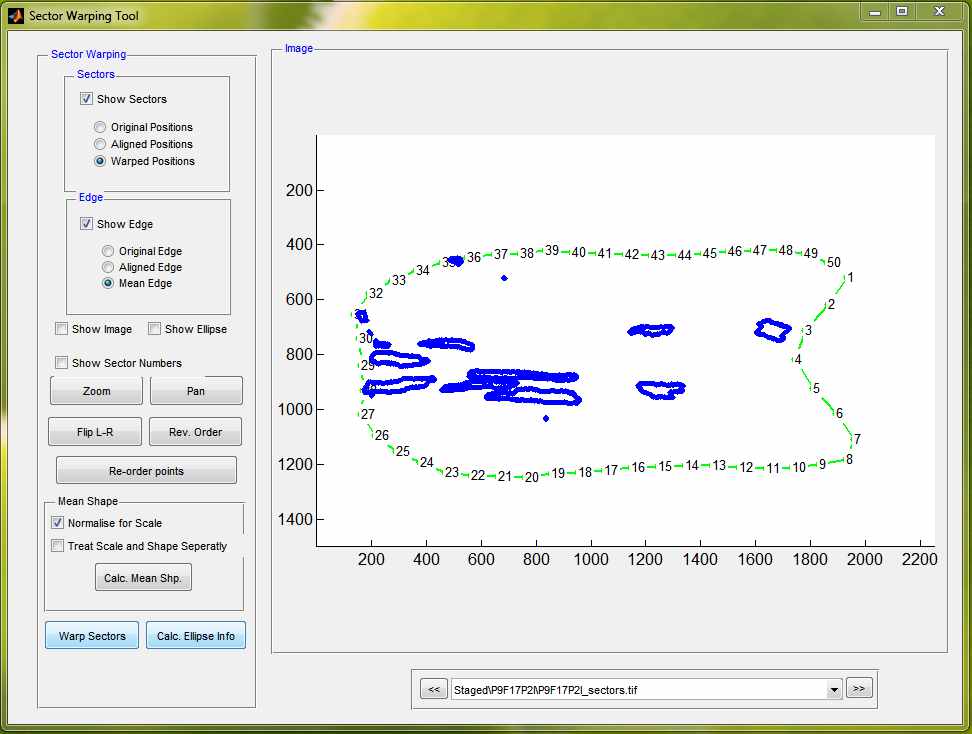
- Sector Warping
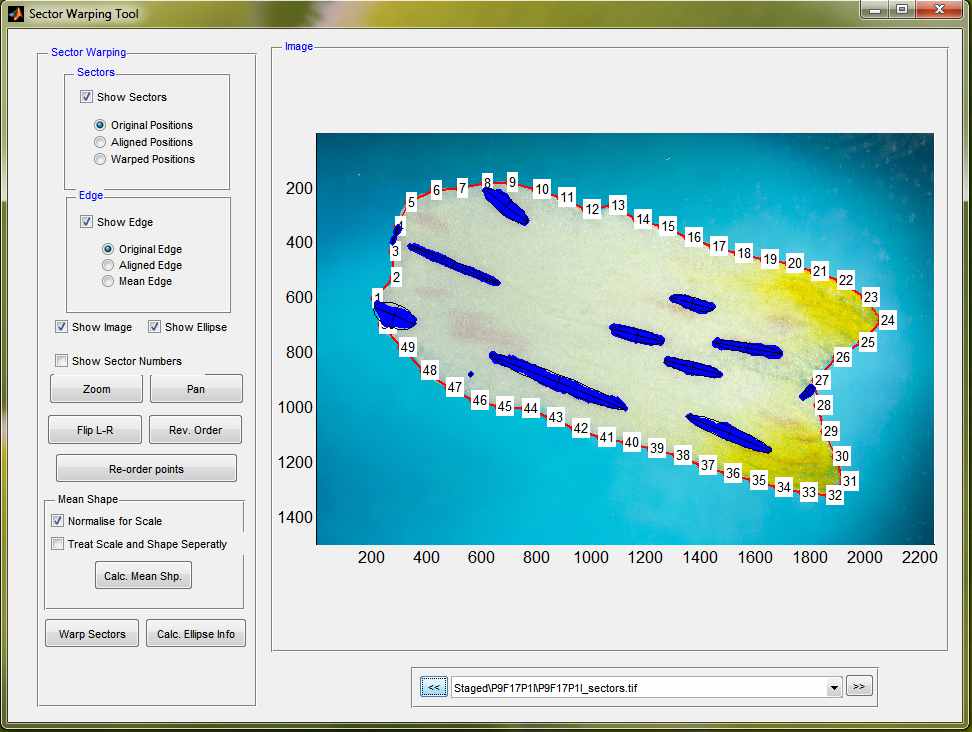

The first image from the Staged folder should be displayed in this window. The outline of the petal section and the sectors are marked on the image in the same way as they were in the Sector Editor Tool – now, the edited edge points and sectors should be displayed. As in the Sector Editor Tool, the boxes Show Sectors and Show Edge can be toggled to show or hide the edge outline and the pattern of blue sectors. The image can be shown or hidden by ticking or making blank the Show Image box. Once the sector ellipses have been calculated, each sector is also displayed as a red ellipse. The sector ellipses can be shown or hidden by ticking or making blank the Show Ellipse box. Note that the view image button can be unticked to speed up the process of going through the different files.
When all images have been checked so they have the points running in the same order around their outlines, the button Calc. Mean Shape should be clicked, followed by Warp Sectors (user selects the images to be warped and chooses the appropriate warping algorithm), then Calculate Ellipse Info (user selects images to be processed, and also the algorithm to be used (choose AIH for the closest fit of ellipses). These buttons calculate the mean organ shape of the dataset (information saved under mean_shape.mat in the Data folder), then warp the sectors of every image to fit this mean shape. Then, the sector ellipses are calculated for every image in the Staged folder. Warped information is saved in the structure file warped_sectors_info.mat.
By selecting the Mean Edge selection bullet the mean petal shape is displayed (as a green outline) and selecting the Warped Positions selection bullet, the warped sector patterns are shown on the mean shape.
- Mean petal shape and warped sector positions