Tutorials on the Shape modelling toolbox: Difference between revisions
No edit summary |
|||
| (13 intermediate revisions by the same user not shown) | |||
| Line 3: | Line 3: | ||
The models shown in these tutorials illustrate features of the AAMToolbox software. They are not designed to understand the shape and appearance modelling which is better done from the published literature [http://www.computer.org/portal/web/csdl/doi/10.1109/34.982900 for example].<br> | The models shown in these tutorials illustrate features of the AAMToolbox software. They are not designed to understand the shape and appearance modelling which is better done from the published literature [http://www.computer.org/portal/web/csdl/doi/10.1109/34.982900 for example].<br> | ||
Viewing these pages. Some versions of ''Firefox'' and ''Explorer'' do not create satisfactory prints even though you can view the pages with no problems. ''Chrome'' does appear to produce good printouts. | Viewing these pages. Some versions of ''Firefox'' and ''Explorer'' do not create satisfactory prints even though you can view the pages with no problems. ''Chrome'' does appear to produce good printouts. | ||
=Appearance models use OpenGL code to warp the image= | |||
This means that the C code needs to be recompiled whenever Matlab/OS changes. All the required files are in the Directory BuildSFAM. [[Compiling AAMToolbox triwarp |Compiling AAMToolbox triwarp]]<br><br> | |||
=<span style="color:Navy;">Fives ways to use ''AAMToolbox ''= | =<span style="color:Navy;">Fives ways to use ''AAMToolbox ''= | ||
1) [[AAMToolbox Documentation#2 Creating shape models in 2D| '''Analysing shapes.''']] i.e. the arrangement of points around a shape<br><br> | 1) [[AAMToolbox Documentation#2 Creating shape models in 2D| '''Analysing shapes.''']] i.e. the arrangement of points around a shape<br><br> | ||
| Line 24: | Line 26: | ||
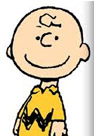
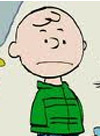
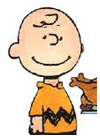
Image:CB9.jpg | Image:CB9.jpg | ||
</gallery> | </gallery> | ||
='''1''' <span style="color:Navy;">'''How''' to analyse 2D shapes using the Graphical User Interface< | ='''1''' <span style="color:Navy;">'''How''' to analyse 2D shapes using the Graphical User Interface</span>= | ||
The process of analysing a set of images is:- | The process of analysing a set of images is:- | ||
{| border="0" cellpadding="5" cellspacing="3" | {| border="0" cellpadding="5" cellspacing="3" | ||
| Line 39: | Line 41: | ||
#'''View the result''' by varying each important component in turn. We call this ''walking'' the shape model. This movie shows a walk. | #'''View the result''' by varying each important component in turn. We call this ''walking'' the shape model. This movie shows a walk. | ||
#*[[AAMToolbox viewing statistical model|Tutorial on viewing statistical model.]] | #*[[AAMToolbox viewing statistical model|Tutorial on viewing statistical model.]] | ||
#''' | #'''Best fit point model''' using only the principle components. | ||
#*[[AAMToolbox simplify point model|Tutorial on fitting a model to a particular image.]] | |||
|width="300pt"|<wikiflv width="300" height="300" logo="false" loop="true" background="white">CartoonPC1.flv|CartoonPC1.png</wikiflv><br> | |width="300pt"|<wikiflv width="300" height="300" logo="false" loop="true" background="white">CartoonPC1.flv|CartoonPC1.png</wikiflv><br> | ||
Mean shape (points) joined by lines. The movie shows deviations from the mean by varying the principle component. | Mean shape (points) joined by lines. The movie shows deviations from the mean by varying the principle component. | ||
|} | |} | ||
='''2''' <span style="color:Navy;">'''Viewing the results''' in ''Shape-Space''< | ='''2''' <span style="color:Navy;">'''Viewing the results''' in ''Shape-Space''.''' What is Shape-Space?'''</span>= | ||
{| border="0" cellpadding="5" cellspacing="3" | {| border="0" cellpadding="5" cellspacing="3" | ||
| Line 49: | Line 52: | ||
|width="700pt"| | |width="700pt"| | ||
#PCA allows us to view the | #PCA allows us to view the data from a new angle: ''Shape Space'' rather than normal viewing space. This movie shows a trajectory through shape space that is projected back into normal viewing space. | ||
#*[[AAMToolbox viewing one population in shape space|Tutorial on shape space.]] | #*[[AAMToolbox viewing one population in shape space|Tutorial on shape space.]] | ||
|width="300pt"|<wikiflv width="300" height="300" logo="false" loop="true" background="white">CartoonPC2.flv|PC2_cartoon_2.png</wikiflv> | |width="300pt"|<wikiflv width="300" height="300" logo="false" loop="true" background="white">CartoonPC2.flv|PC2_cartoon_2.png</wikiflv><br> | ||
Interpolating a walk from one point model shape to another in shape space. | |||
|} | |} | ||
='''3''' <span style="color:Navy;">'''Comparing shapes''' | |||
---- | |||
=Seen these elsewhere?= | |||
[[Image:PortraitsMEANSsmaller.jpg|800px]] | |||
='''3''' <span style="color:Navy;">'''Comparing shapes''' in ''Shape-Space''.</span>= | |||
{| border="0" cellpadding="5" cellspacing="3" | {| border="0" cellpadding="5" cellspacing="3" | ||
|- valign="top" | |- valign="top" | ||
|width="700pt"| | |width="700pt"| | ||
None of the above portraits exist. They were created by placing point models on samples of each painters work and computing the PCA of both the shape and the appearance. Each image is the mean shape coloured with the mean appearance. Dates: Giotto (~1300), Leonardo da Vinci (~1600), Valazquez (~1630), Rembrandt (~1650), Modigliani (~1900), Soutine (~1930). | |||
#Compare shapes of different populations in shape space. | |||
#*Groups of samples can be projected into a common shape space and compared. In this case portraits. | |||
#*By focussing on the main contributions to shape it might be possible to relate positions in shape space to, for example, genotype in leaves ([http://www.pnas.org/content/102/29/10221.short Langlade ''et al'' 2005.],[http://www.tandfonline.com/doi/abs/10.2976/1.2836738 Bensmihen ''et al.'' 2010]) and petals ([http://www.sciencemag.org/content/313/5789/963.short Whibley ''et al'' 2006],[http://www.mssaleshops.info/content/21/10/2999.short Feng ''et al''. 2010]) | |||
#*In the portraits example (right) imagine a diagonal line roughly from top-left to bottom right. It goes from Rembrandt to El Greco. We might note that Modigliani and Soutine are closer to the stylised images of El Greco than pictures from the middle period (1600<=middle<=1930) when the artists appear to have aimed for realism. | |||
#[[Shape and GFtbox modelling| Tutorial on shape and GFtbox modelling]] | |||
|width="300pt"|[[Image:AAMToolboxPortraitsShapeSpace.jpg|400px]]Portraits by different painters projected into a shape space created by PCA of all the results. Conclusions? | |||
|} | |} | ||
Latest revision as of 19:30, 2 July 2014
Back to AAMToolbox Documentation
The models shown in these tutorials illustrate features of the AAMToolbox software. They are not designed to understand the shape and appearance modelling which is better done from the published literature for example.
Viewing these pages. Some versions of Firefox and Explorer do not create satisfactory prints even though you can view the pages with no problems. Chrome does appear to produce good printouts.
Appearance models use OpenGL code to warp the image
This means that the C code needs to be recompiled whenever Matlab/OS changes. All the required files are in the Directory BuildSFAM. Compiling AAMToolbox triwarp
Fives ways to use AAMToolbox
1) Analysing shapes. i.e. the arrangement of points around a shape
2) Viewing the data in shape space. i.e. approximating the data with two principle components
3) Comparing shapes from samples of different groups for example, comparing faces from different cartoon characters
4) Analysing shape and appearance. In addition to the points around a shape, analyse the appearance (grey scale or colour) within the shape.
5) Analysing 3D shapes
How to use these tutorials. First download and install the AAMToolbox. A zip file containing the project (PRJ_CartoonFaces) is available here. Download and unzip into a directory. Then, from Matlab, change directory into the project and launch the AAMToolbox
cd PRJ_CartoonFaces
AAMToolbox
This project contains as set of faces that have been analysed using 2D shape models
- The set of faces


1 How to analyse 2D shapes using the Graphical User Interface
The process of analysing a set of images is:-
|
<wikiflv width="300" height="300" logo="false" loop="true" background="white">CartoonPC1.flv|CartoonPC1.png</wikiflv> Mean shape (points) joined by lines. The movie shows deviations from the mean by varying the principle component. |
2 Viewing the results in Shape-Space. What is Shape-Space?
|
<wikiflv width="300" height="300" logo="false" loop="true" background="white">CartoonPC2.flv|PC2_cartoon_2.png</wikiflv> Interpolating a walk from one point model shape to another in shape space. |
Seen these elsewhere?

3 Comparing shapes in Shape-Space.
|
None of the above portraits exist. They were created by placing point models on samples of each painters work and computing the PCA of both the shape and the appearance. Each image is the mean shape coloured with the mean appearance. Dates: Giotto (~1300), Leonardo da Vinci (~1600), Valazquez (~1630), Rembrandt (~1650), Modigliani (~1900), Soutine (~1930).
|
 Portraits by different painters projected into a shape space created by PCA of all the results. Conclusions? Portraits by different painters projected into a shape space created by PCA of all the results. Conclusions?
|