Types of 1D sieve
Jump to navigation
Jump to search
Types of 1D sieve
Summary of outputs
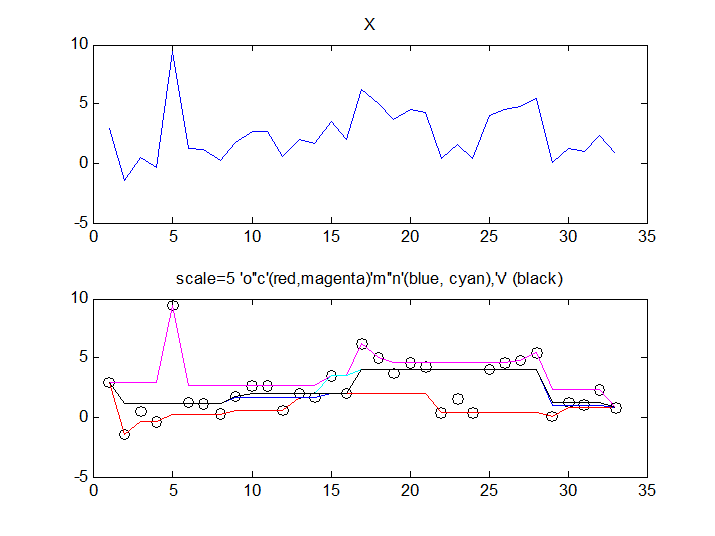
We understand MSER's to be based on opening ('o') and closing ('c') sieves. At each scale either the minima ('o') or the maxima ('c') of that scale are removed. The output therefore 'floats' along the bottom or the top of the data. In the following Figure they are shown in red and cyan. They bracket the data. Subtracting output from each scale from the previous one yields the maxima or minima for each scale, some of which may be selected as interest points.
 Top: our standard signal to which randn noise has been added to help us distinguish the different outputs. Bottom: all sieves are to scale 5. 'o' and 'c' (red, cyan) remove minima and maxima and so 'float' along the top and bottom of the data. 'M' and 'N' have compound operators ('o' then 'c' and 'c' then 'o'). They do a better job of outputting some sort of representation of the underlying signal. 'v' (elsewhere named lowercase 'm') is also a compound operator - this time applying 'o' and 'c' at random. The result (black) appears to be the best at representing the underlying signal (at scale 5 - this also applies to all scales. The output lies between outputs from 'M' and 'N'.
 The idea that we can remove the max and minima at random at a particular scale and still get what appears to be the best representation of the underlying signal might prove to be 'magic' when we explore new filtering schema.
Which is best?
For segmenting images we have found 'v' sieves to be the best - indeed for most things we have tried. We have not tried finding interest points - particularly in 1D.